This topic contains a solution. Click here to go to the answer
|
|
|

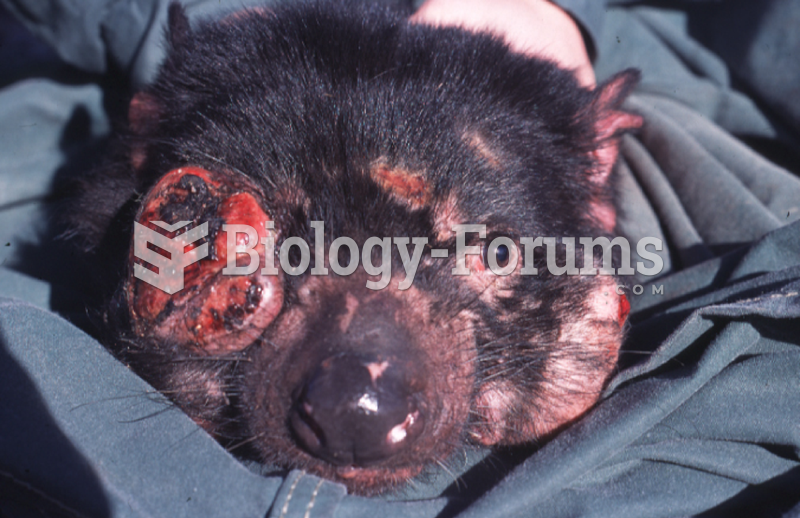 Devil facial tumour disease causes tumours to form in and around the mouth, interfering with feeding
 Marjane Satrapi, page from the "Kim Wilde" chapter of the graphic novel Persepolis.
 Instructions for Completing the CMS-1500 (02/12) Claim Form Continued
 The relationship between the height of the firing line and length of the spark line can be ...
 You heat 3.952 g of a mixture of Fe3O4 and FeO to form 4.162 g Fe2O3. The mass of oxygen ...
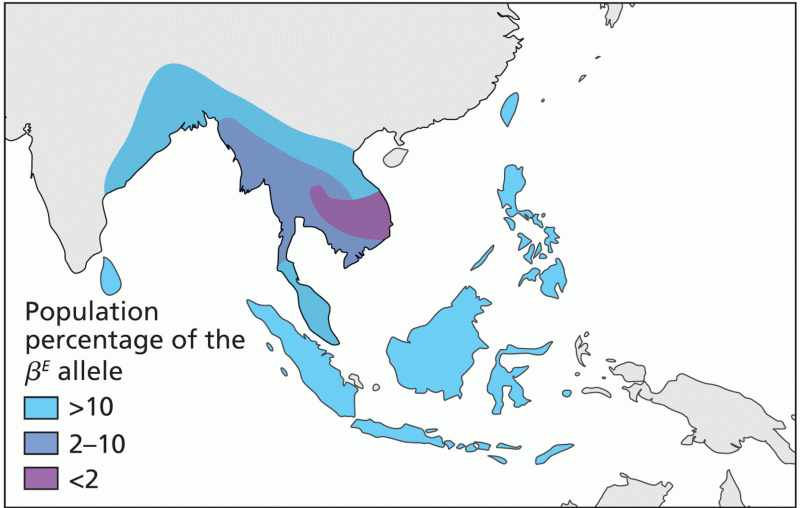 The frequency distribution of the allele in Southeast Asia and the Pacific Islands