This topic contains a solution. Click here to go to the answer
|
|
|

 Bipolar disease. The term bipolar means “pertaining to two poles.” The individual with this form of
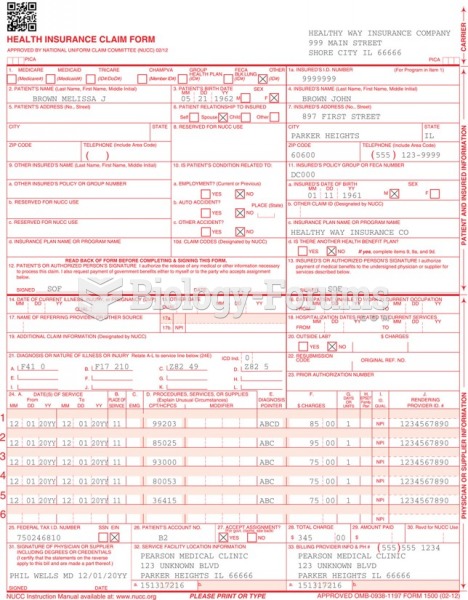 A completed CMS-1500 (02/12) claim form.
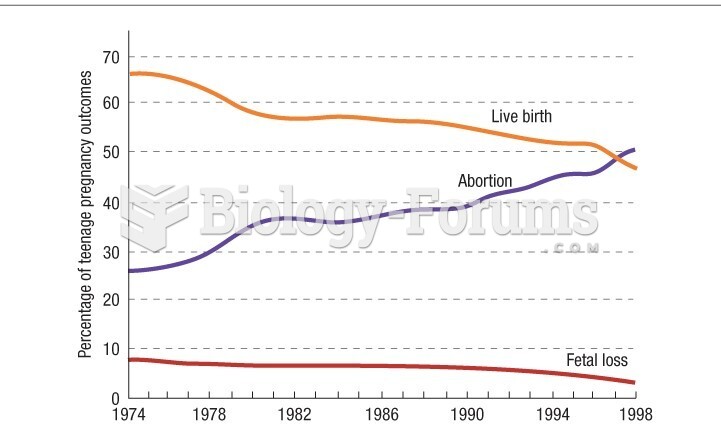 Percentage distribution of outcomes of teenaged pregnancy
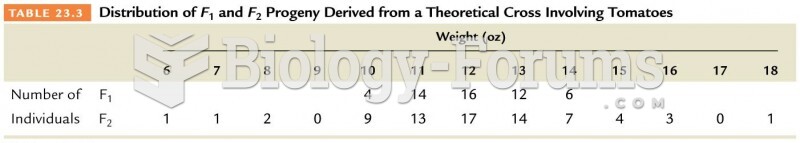 Distribution of F1 and F2 Progeny Derived from a Theoretical Cross Involving Tomatoes
 The relationship between recombination frequency and physical distance between genes
 Distribution of fluid compartments in the body