This topic contains a solution. Click here to go to the answer
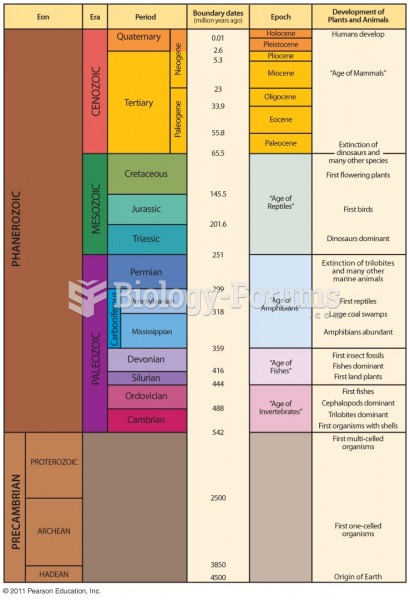
Author Question: Listing each possible score value and then placing a tally mark next to each score for each time ... (Read 89 times)

Melani1276

  • Hero Member
  • *****
  • Posts: 516
Listing each possible score value and then placing a tally mark next to each score for
  each time it occurs in a set of scores results in a(n) _____ frequency distribution.
 
  a. ungrouped
  b. grouped
  c. relative
  d. cumulative

Question 2

A table showing each score in a set of scores and the number of times it occurred is called
  a _____ .
 
  a. histogram
   b. frequency distribution
  c. frequency polygon
  d. frequency polygram


Related Topics

Need homework help now?

Ask unlimited questions for free

Ask a Question
Marked as best answer by a Subject Expert

Mollythedog

  • Sr. Member
  • ****
  • Posts: 340
Answer to Question 1

A

Answer to Question 2

B


Melani1276

  • Member
  • Posts: 516
Reply 2 on: Jun 20, 2018
Excellent


ttt030911

  • Member
  • Posts: 315
Reply 3 on: Yesterday
:D TYSM


Did you know?

There are approximately 3 million unintended pregnancies in the United States each year.

Did you know?

Critical care patients are twice as likely to receive the wrong medication. Of these errors, 20% are life-threatening, and 42% require additional life-sustaining treatments.

Did you know?

Throughout history, plants containing cardiac steroids have been used as heart drugs and as poisons (e.g., in arrows used in combat), emetics, and diuretics.

Did you know?

In ancient Rome, many of the richer people in the population had lead-induced gout. The reason for this is unclear. Lead poisoning has also been linked to madness.

Did you know?

About 3% of all pregnant women will give birth to twins, which is an increase in rate of nearly 60% since the early 1980s.

For a complete list of videos, visit our video library