This topic contains a solution. Click here to go to the answer
|
|
|

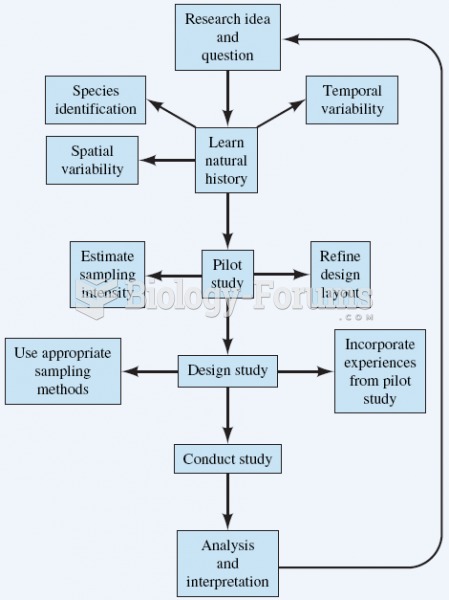 Much time and effort occurs between the development of a research idea and the statistical analysis
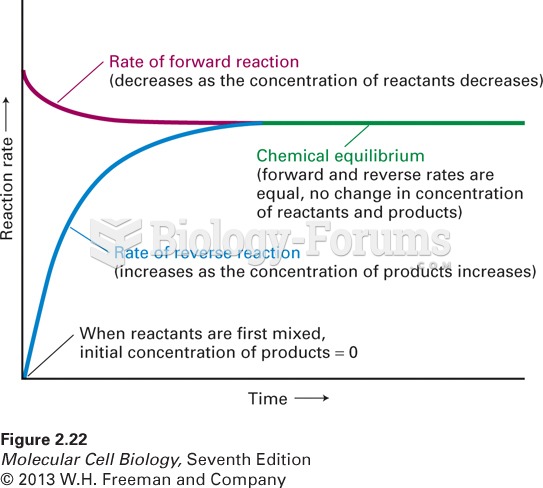 Time dependence of the rates of a chemical reaction
 Having a time zone map located near the telephone will assist you when making long distance calls ou
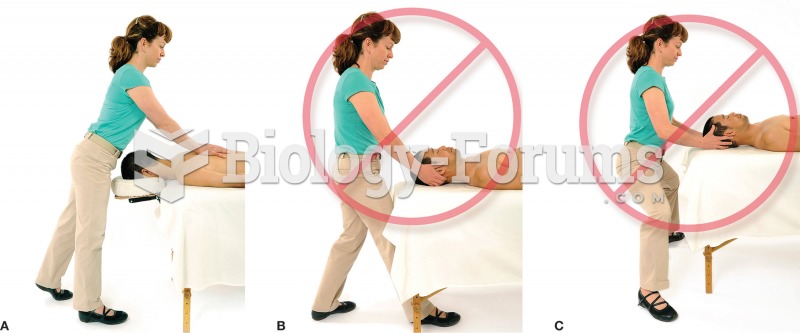 a) When standing, keep your weight over your front leg. b) Avoid placing your foot under the table. ...
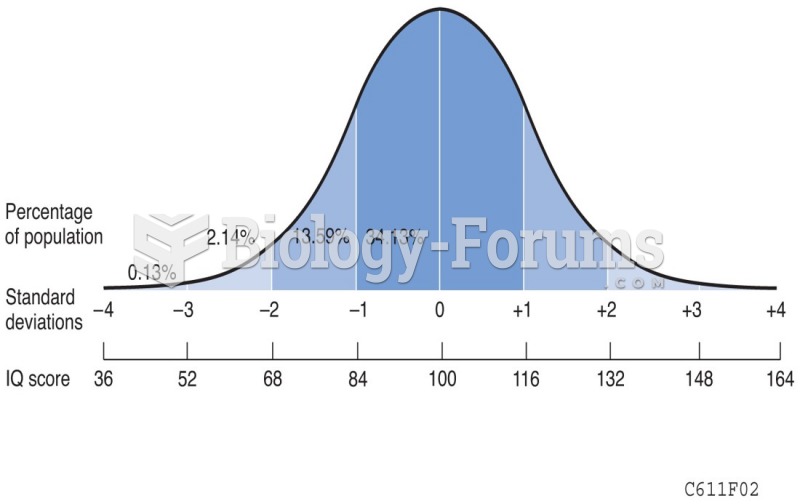 Calculating the Deviation IQ Score
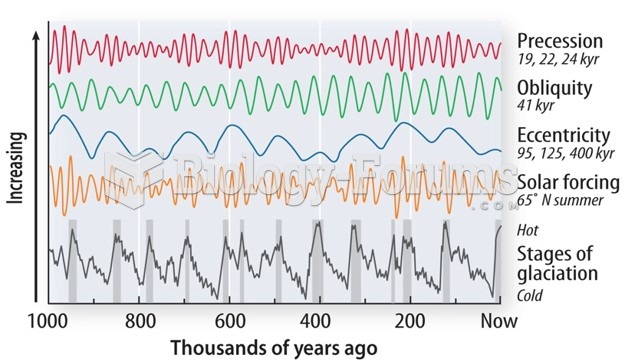 Milankovitch cycles interact over time