This topic contains a solution. Click here to go to the answer
|
|
|

 Time Slows Down Near Matter
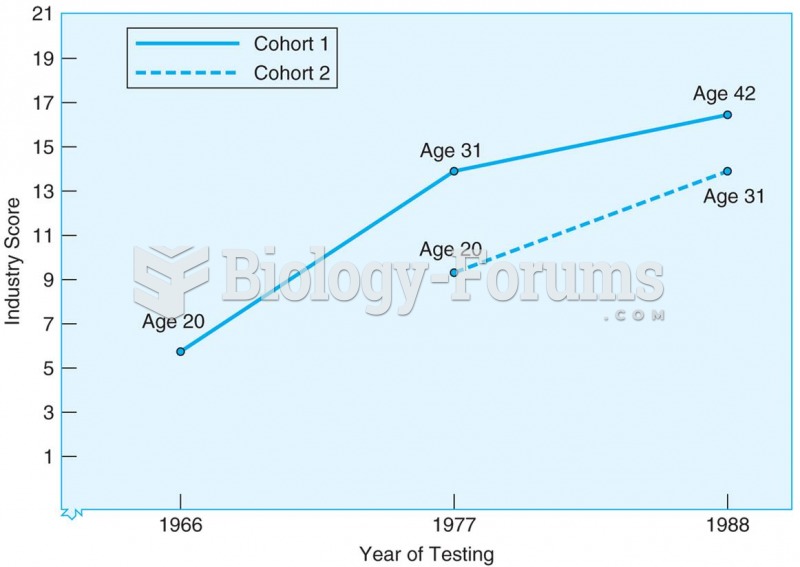 Results from sequential study of two cohorts tested at three ages and at three different points in t
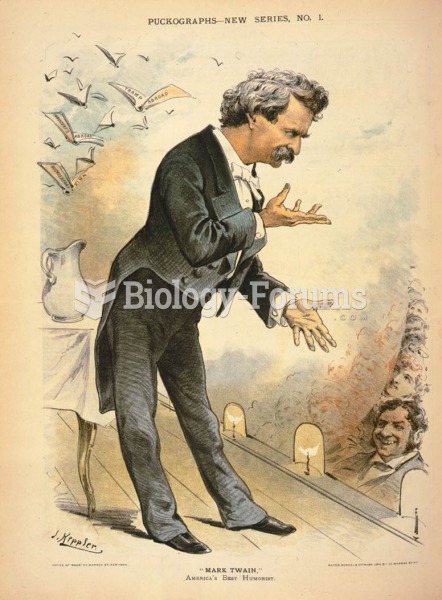 Mark Twain supplemented his income as a writer by giving humorous lectures.
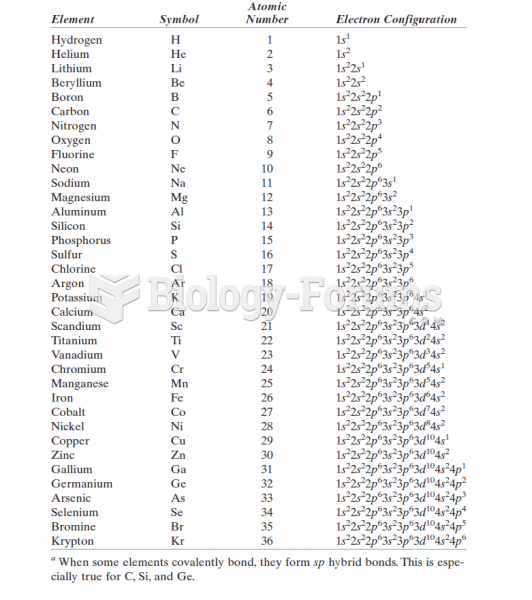 A Listing of the Expected Electron Configurations for Some of the Common Elementsa
 Squeeze forearm by placing your hands on both sides of the forearm and squeeze from elbow to wrist.
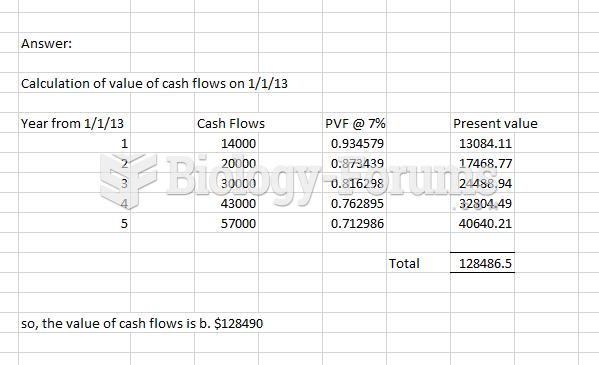 Time value money