This topic contains a solution. Click here to go to the answer
|
|
|

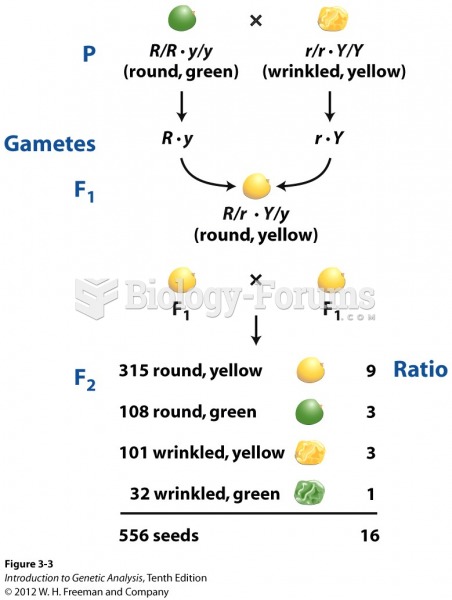 Mendel's breeding program that produced a 9 : 3 : 3 : 1 ratio
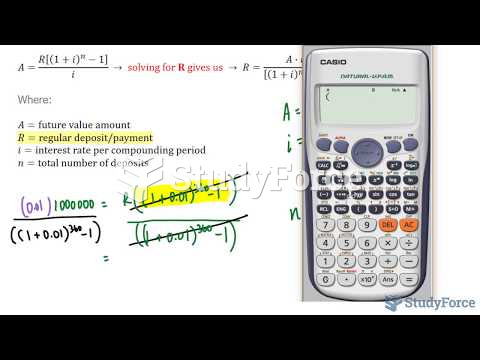 How to calculate regular payments or deposits using the annuity formula (Question 1)
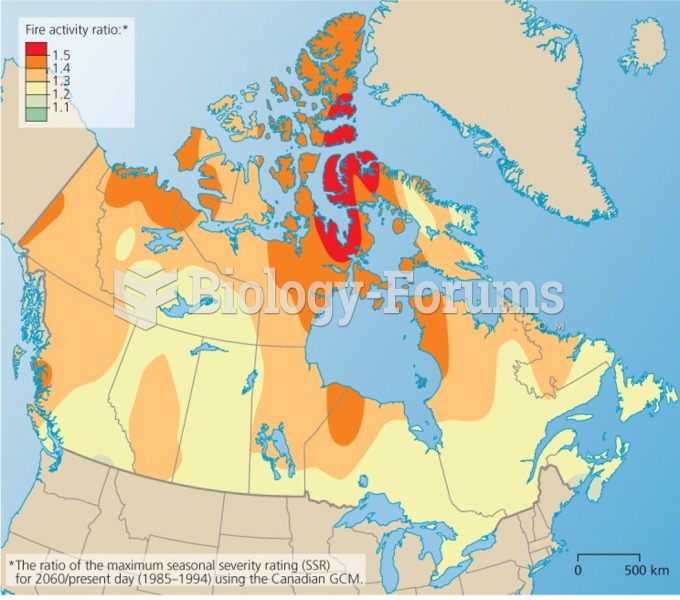 Fire activity ratio
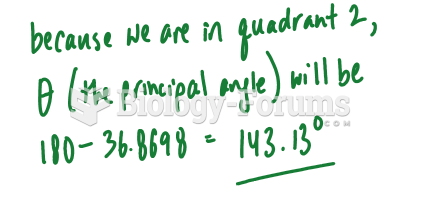 Finding the angle from a ratio (Part 2)
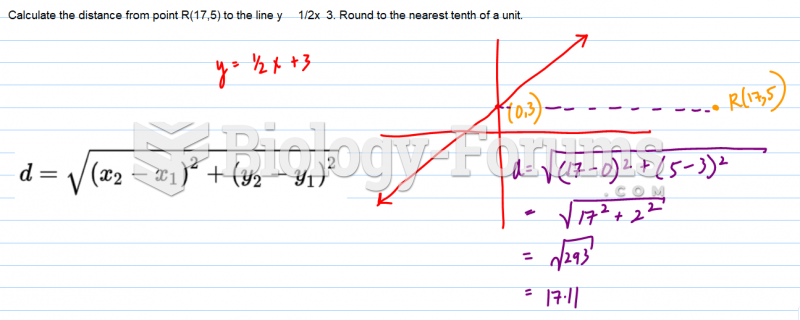 Calculate the distance from point R(17,5) to the line ... Round to the nearest tenth of a
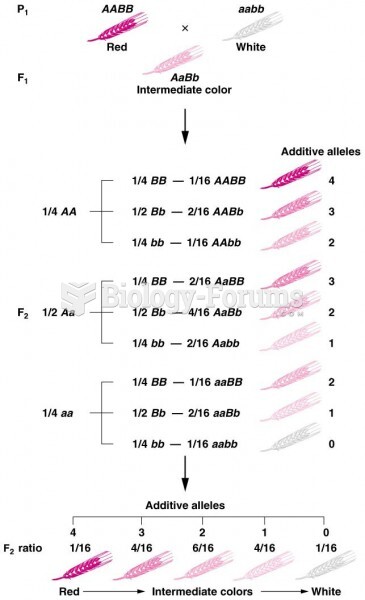 How the multiple-factor hypothesis accounts for the 1:4:6:4:1 phenotypic ratio