This topic contains a solution. Click here to go to the answer
|
|
|

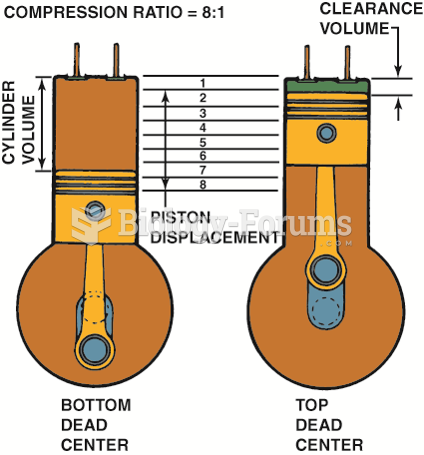 Compression ratio is the ratio of the total cylinder volume (when the piston is at the bottom of ...
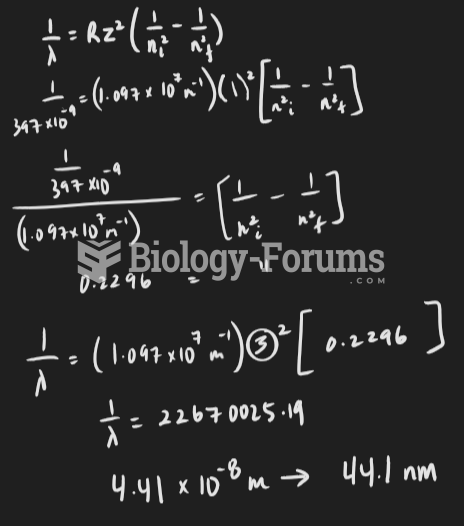 Calculate the Wavelength
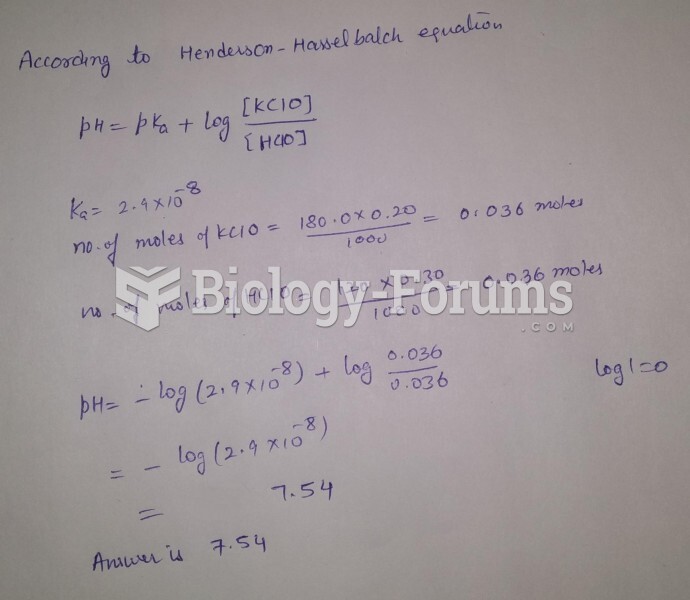 Calculate the pH of a solution formed by mixing 120.0 mL of 0.30 M HClO with 1180.0 mL of 0.20 ...
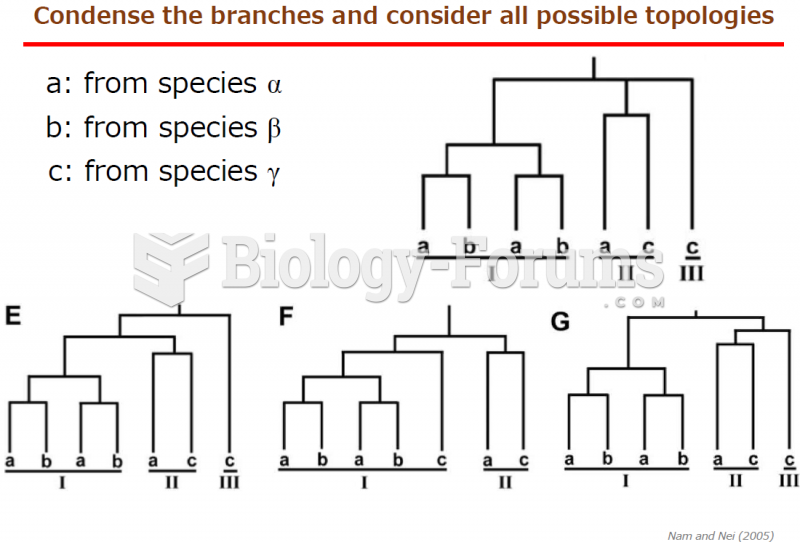 How to calculate the gain and loss gene numbers with low bootstrap of phylogenetic tree?
 Calculate KP for the following reactions at the indicated temperature.
 Gray Morris's Calculate with Confidence, Canadian Edition, 2nd Edition