|
|
|

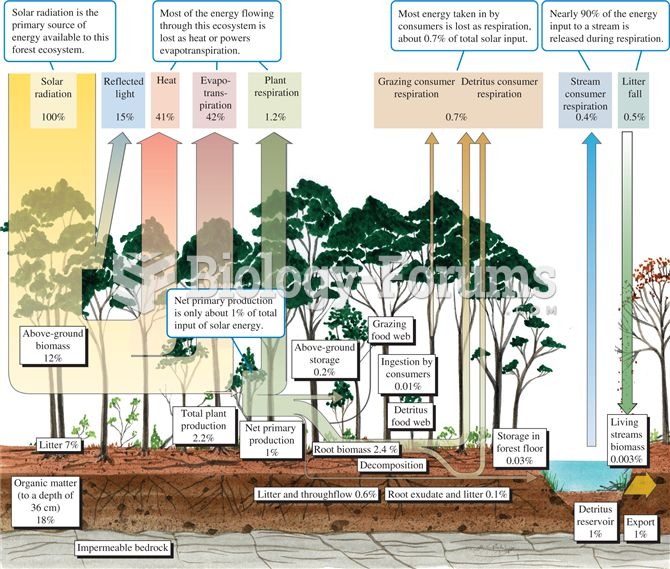 Energy budget for a temperate deciduous forest (data from Gosz et al. 1978).
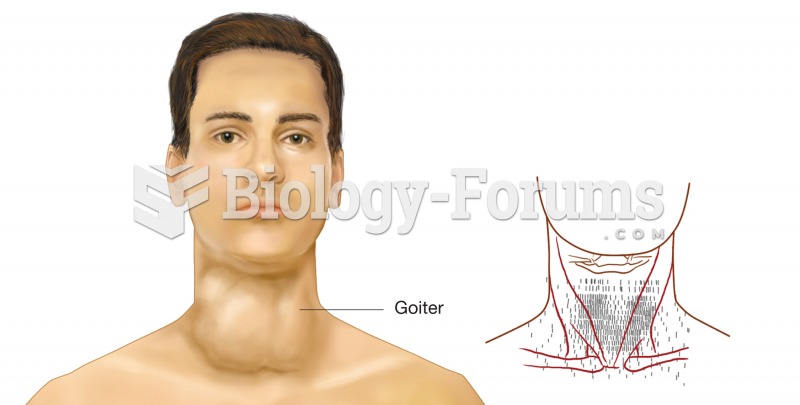 Thyroid scan. The right image is the data from a thyroid scan, printed on a superimposed map of the
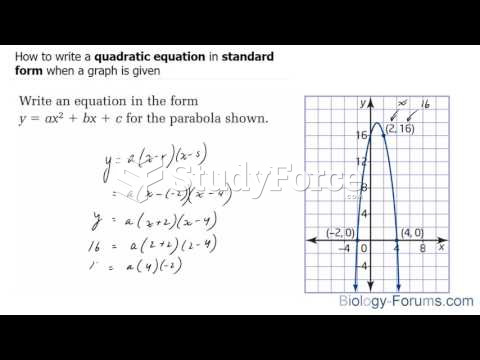 How to write a quadratic equation in standard form when a graph is given
 Gently squeeze the tissues along the eyebrow line between your thumb and forefinger. Begin at the ...
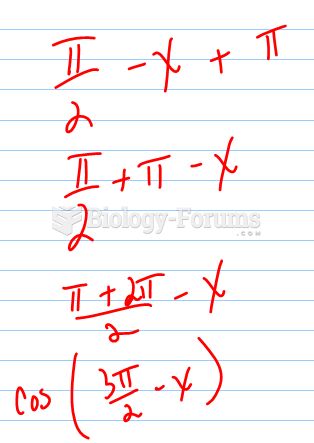 How to find the possible equations of a graph?
 data
data