|
|
|

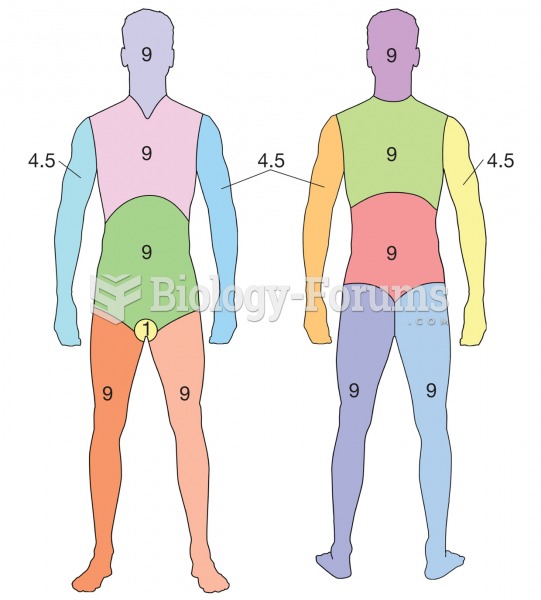 Rule of Nines. A method for determining percentage of body burned. Each different colored section re
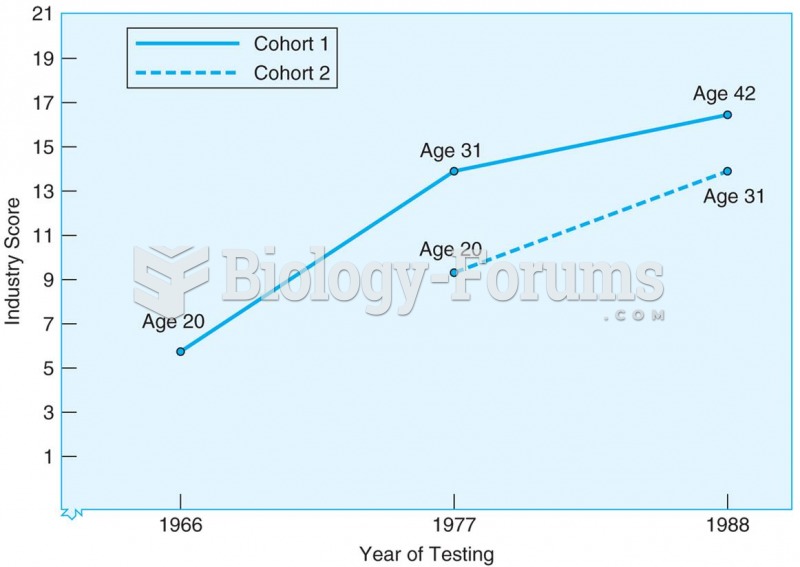 Results from sequential study of two cohorts tested at three ages and at three different points in t
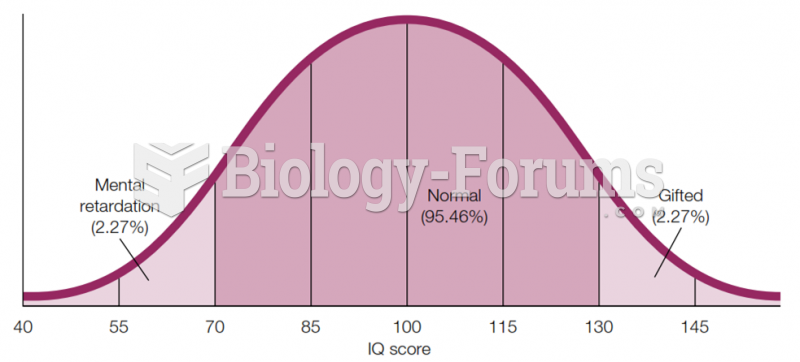 Bell Curve for Intelligence IQ scores for a population-based sample usually fall into this kind of
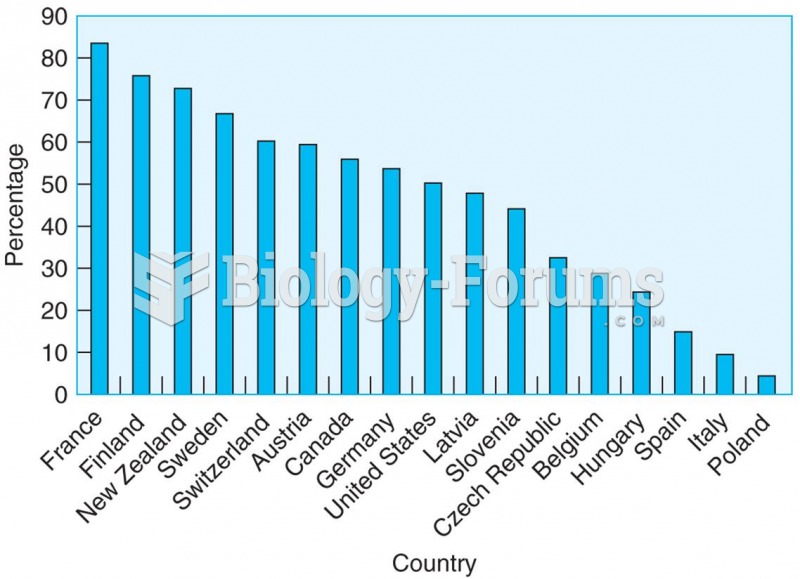 The percentage of women who have cohabited by the age of 45 for 17 countries shows that the ...
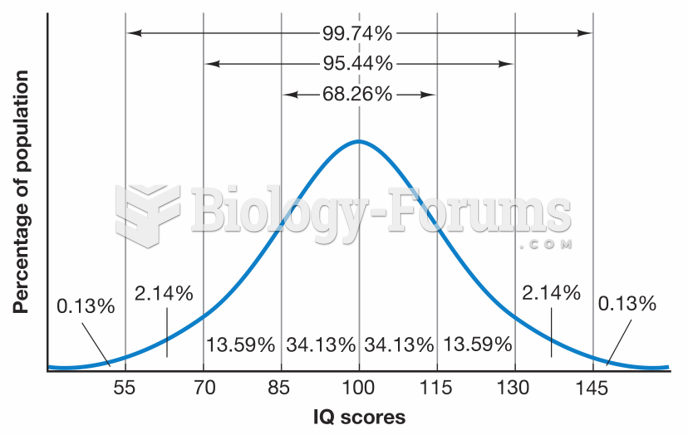 Expected Distribution of IQ Scores
 If CP for an ideal gas is 35.4 J/molK, which of the following is CV for this gas?