|
|
|

 The upper panel shows that scores of four diverse samples of boys on a moral reasoning test show a ...
 What are examples of ideal forms?
 Ways to Measure Percentage of Body Fat
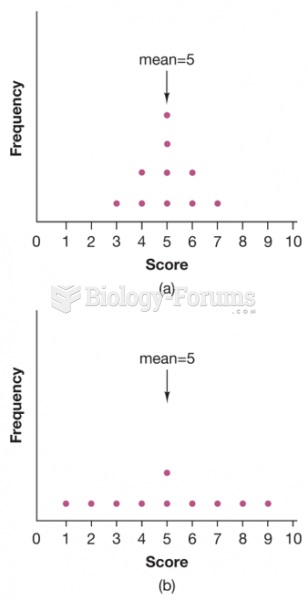 . In which distribution is the mean more “typical” of all scores?
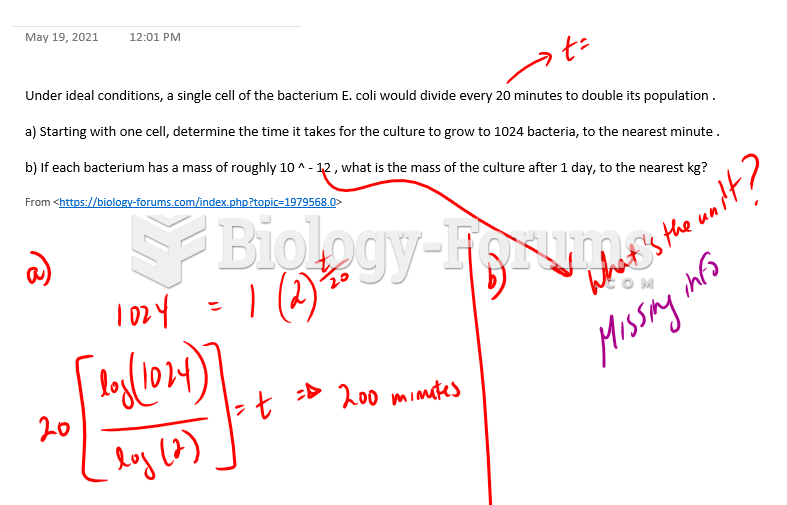 Under ideal conditions, a single cell of the bacterium E. coli would divide every 20 minutes to ...
 Percentage of Full Tryptophan Expression for trpR+ and trpR- Strains