|
|
|

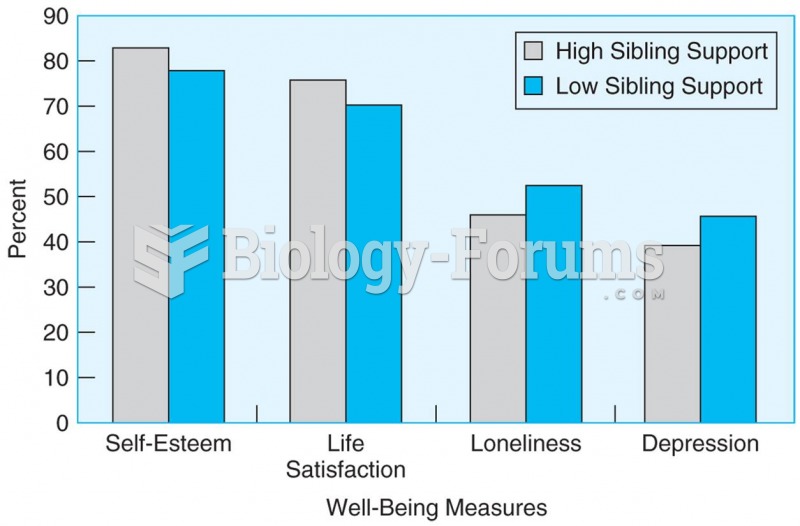 Young adults with low levels of parental support report significantly better scores on measures of ...
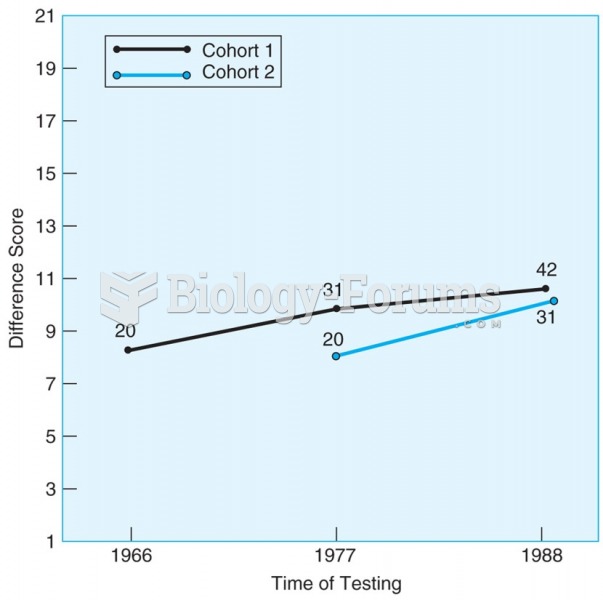 Mean scores for Erikson’s stage V (Identity) for two cohorts. Scores for both cohorts increase ...
 What are examples of ideal forms?
 Ways to Measure Percentage of Body Fat
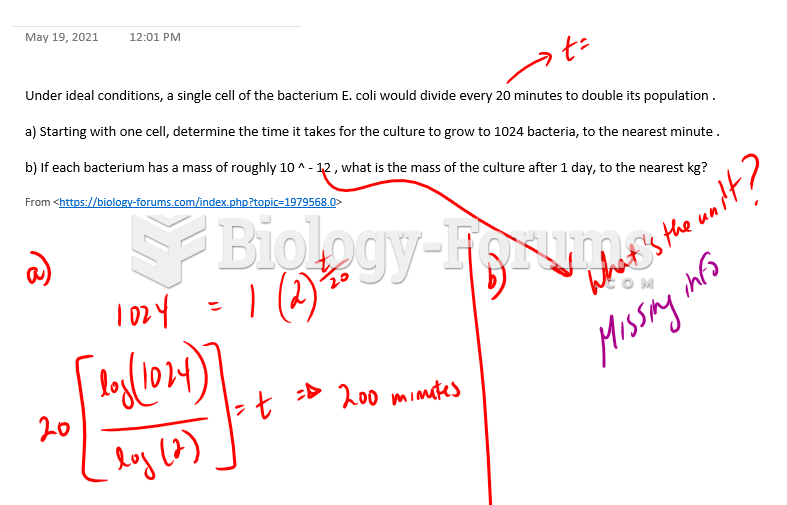 Under ideal conditions, a single cell of the bacterium E. coli would divide every 20 minutes to ...
 What percentage?