This topic contains a solution. Click here to go to the answer
|
|
|

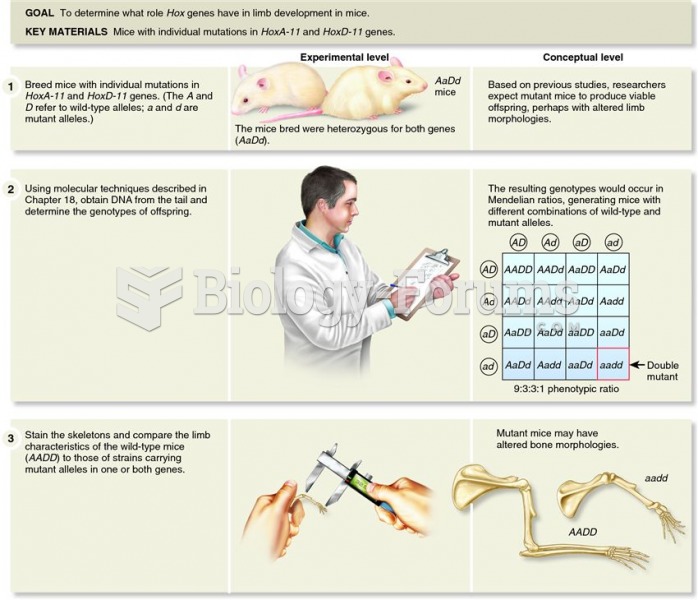 Relatively simple changes in Hox genes control limb formation in tetrapods.
 A melanistic jaguar is a colour morph which occurs at about 6% frequency in populations.
 A patient examination room should be simple and efficiently designed.
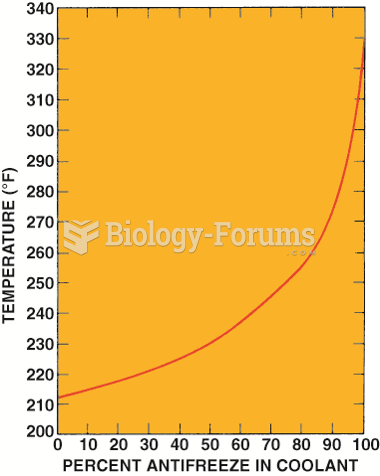 Graph showing how the boiling point of the coolant increases as the percentage of antifreeze in ...
 How to create a table of values from an equation and graph
 Use the graph of the function f(x) to answer each question.