This topic contains a solution. Click here to go to the answer
|
|
|

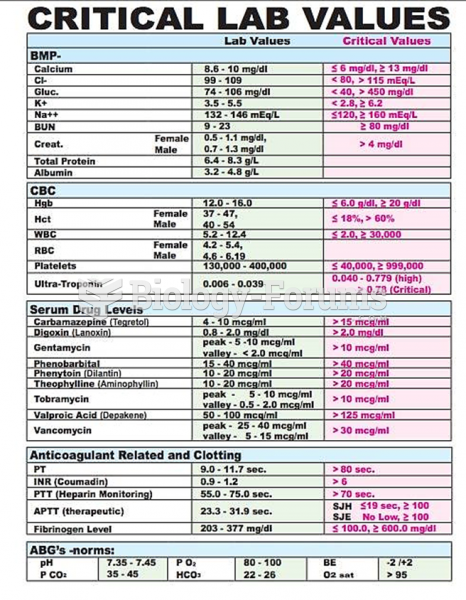 Lab Values
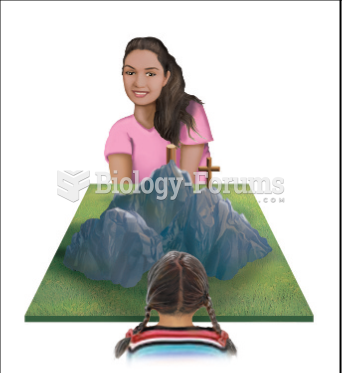 Piaget’s Test for Egocentric Perspectives on Children
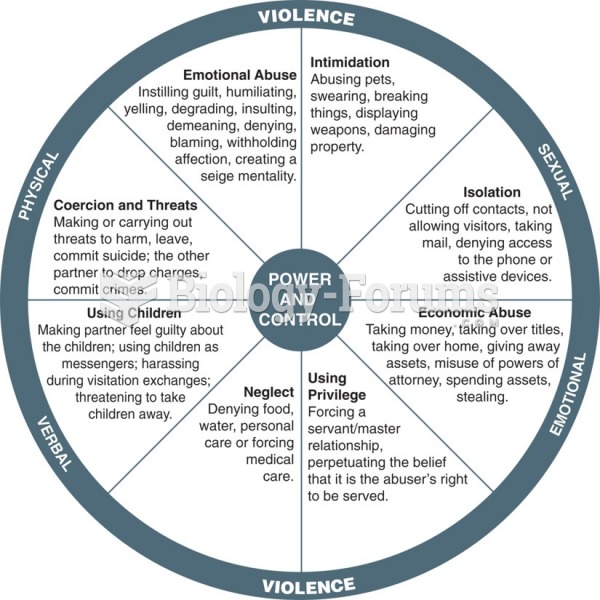 The power and control wheel illustrates the strategies that one partner may use to intimidate, ...
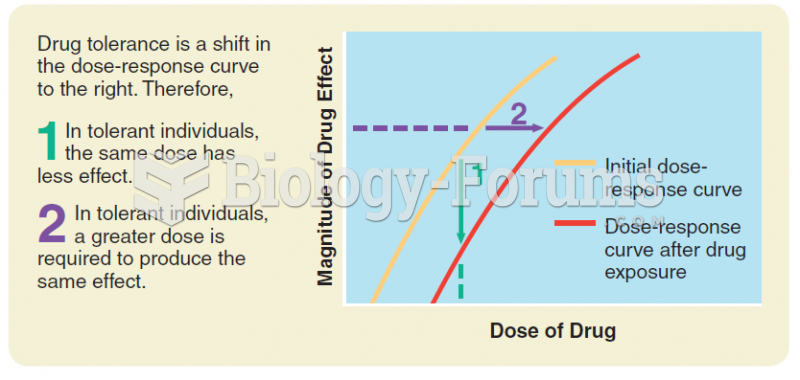 Drug tolerance: A shift in the dose-response curve to the right as a result of exposure to the drug.
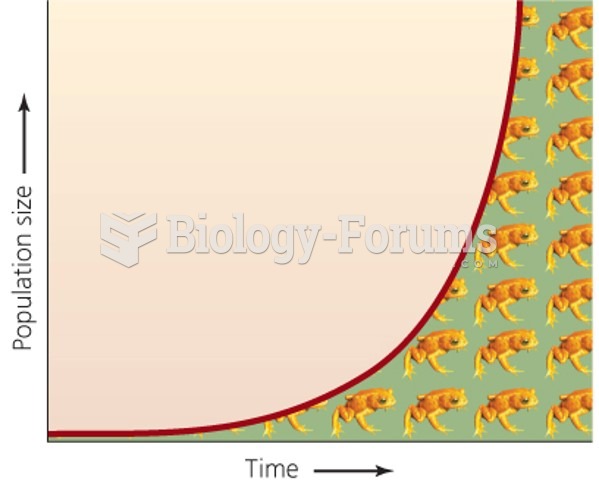 Unregulated populations "J-shaped curve"
 Performing the manual compression test