This topic contains a solution. Click here to go to the answer
|
|
|

 Rinne Test, Assessing Bone Conduction
 Area of Manatee Population
 Power Versus Tripod Grip
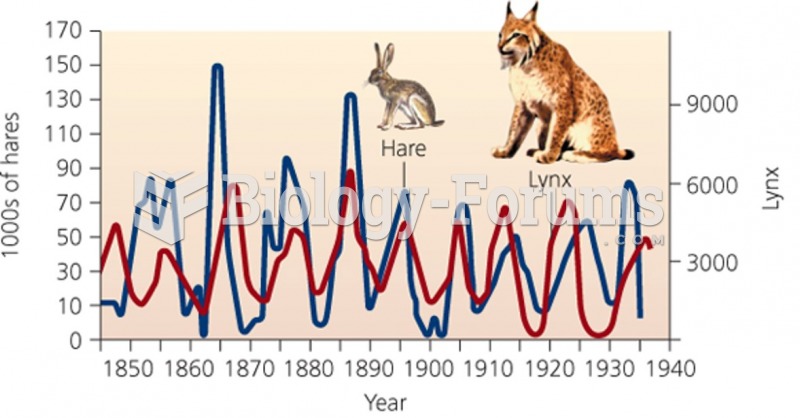 Hares and Lynx population change "الأرانب البرية و الوشق"
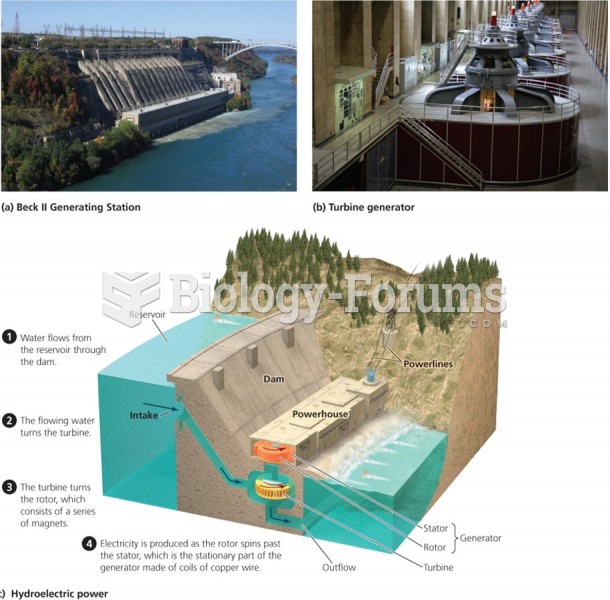 Modern Hydroelectric Power Uses
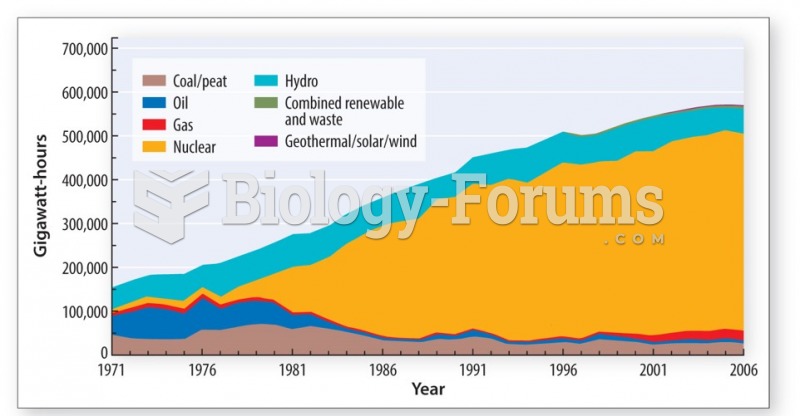 France has produced most of its energy from nuclear power since the oil crisis of the 1970s