If sample data are taken from a population that is normally distributed, a normal probability plot of the observed data values versus the expected z scores will
A) be approximately linear. B) have no discernable pattern.
C) look exponential in nature. D) have a correlation coefficient near 0.
Question 2
A normal probability plot is a graph that plots _____________ versus _____________.
A) observed data, normal scores B) normal score, observed data
C) normal data, observed scores D) observed scores, normal data

 Photoidentification and the North Atlantic humpback whale population.
 Normal and sickle-cell hemoglobin. (a) Subtle differences between the conformations of hemoglobin A
 Normal breath sounds
 Worldwide Variations in Population and Income Levels Developed countries represent only 18% of the
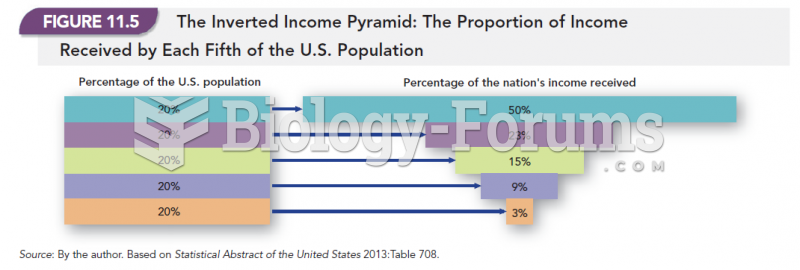 The Inverted Income Pyramid: The Proportion of Income Received by Each Fifth of the U.S. Population