If sample data are taken from a population that is normally distributed, a normal probability plot of the observed data values versus the expected z scores will
A) be approximately linear. B) have no discernable pattern.
C) look exponential in nature. D) have a correlation coefficient near 0.
Question 2
A normal probability plot is a graph that plots _____________ versus _____________.
A) observed data, normal scores B) normal score, observed data
C) normal data, observed scores D) observed scores, normal data

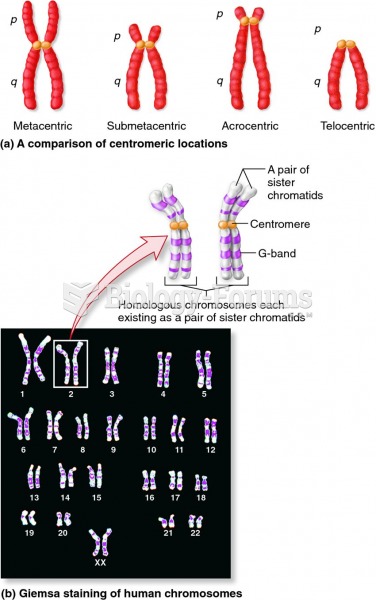 Features of normal metaphase chromosomes.
 A sample prescription written by a physician.
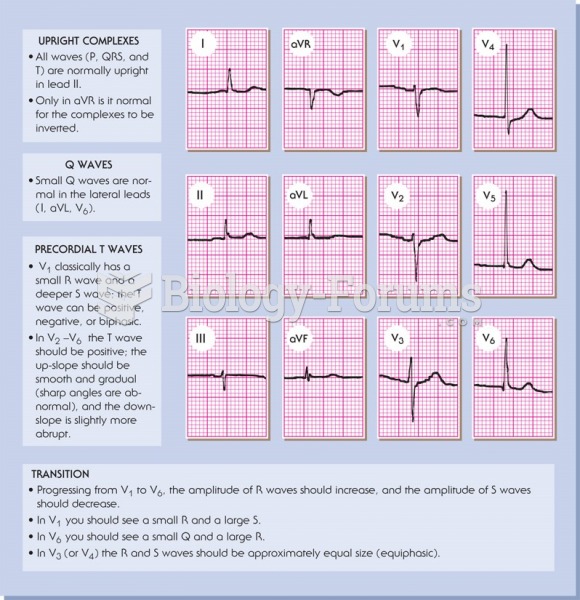 Features of a normal 12-lead ECG.
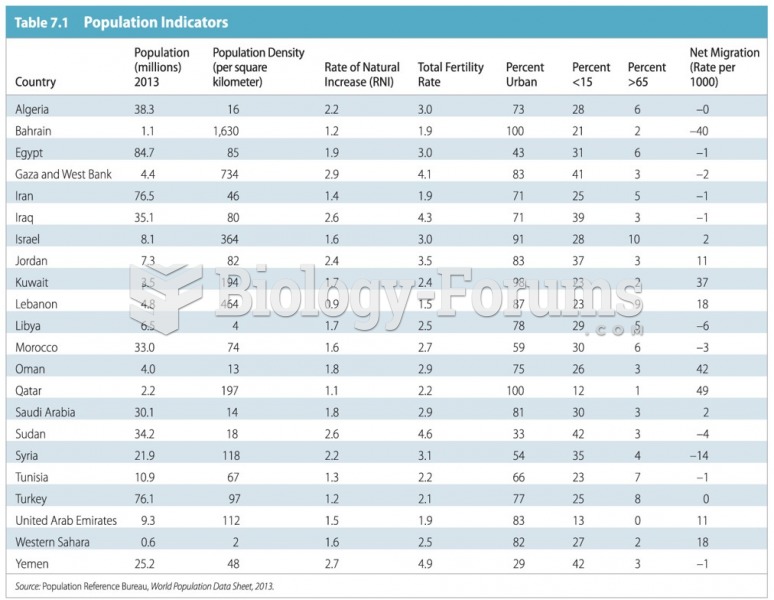 Population Indicators
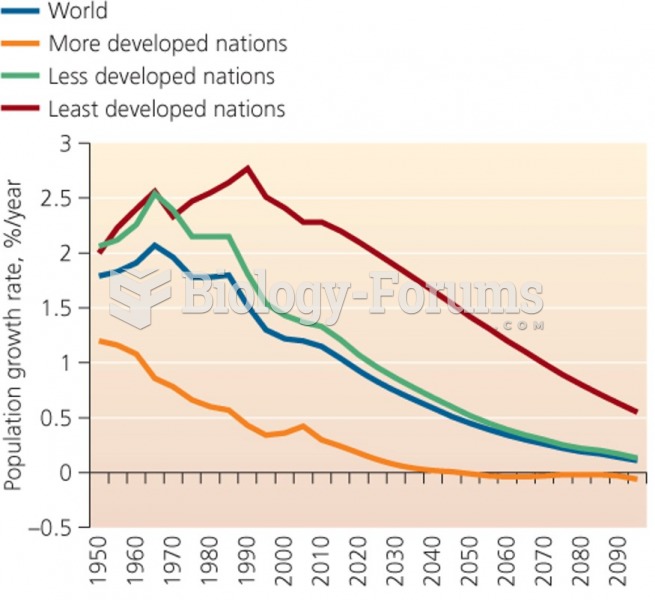 Population growth rate %
 Histograms - Analysis and Data