If sample data are taken from a population that is normally distributed, a normal probability plot of the observed data values versus the expected z scores will
A) be approximately linear. B) have no discernable pattern.
C) look exponential in nature. D) have a correlation coefficient near 0.
Question 2
A normal probability plot is a graph that plots _____________ versus _____________.
A) observed data, normal scores B) normal score, observed data
C) normal data, observed scores D) observed scores, normal data

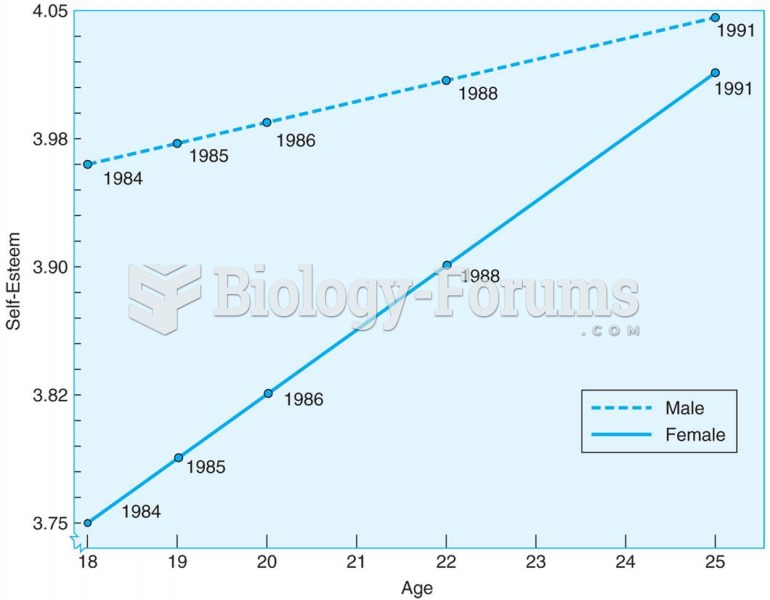 Young adults increase in self-esteem between the ages of 18 and 25, according to this longitudinal s
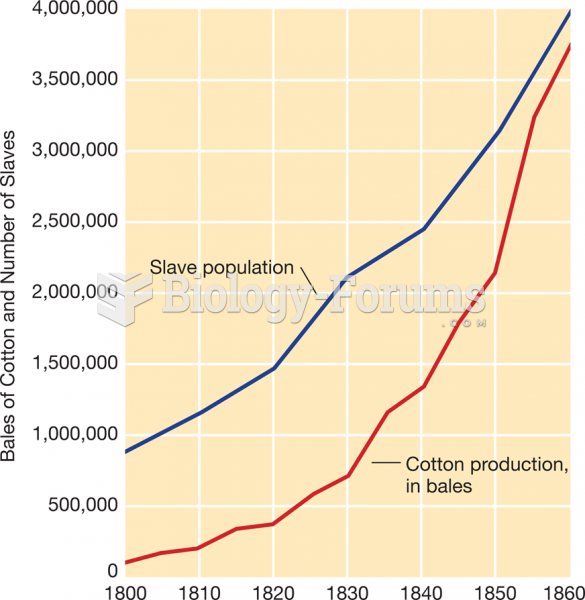 Cotton Production and Slave Population, 1800–1860
 Percentage of Foreign-Born Whites and Native Whites of Foreign or Mixed Parentage in Total Populatio
 Air-Temperature Data
 Population and Settlement
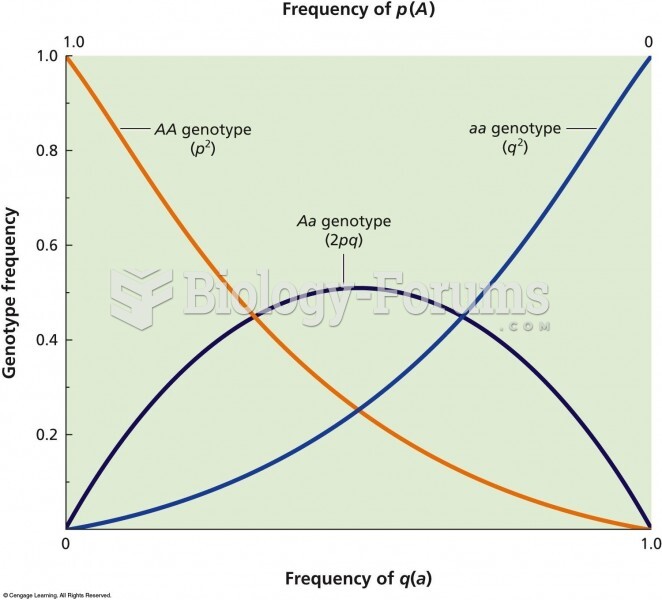 The relationship between allelic frequency and genotypic frequency in a population that is in Hardy-