This topic contains a solution. Click here to go to the answer
|
|
|

 The work of Charles Darwin forms the foundation for modern evolutionary theory.
 How do men who work in traditionally feminine nurturng jobs and women who work in jobs that give ...
 Work and Gender: Women at Work in India
 Many hunger-relief programs work to provide food aid to needy nations
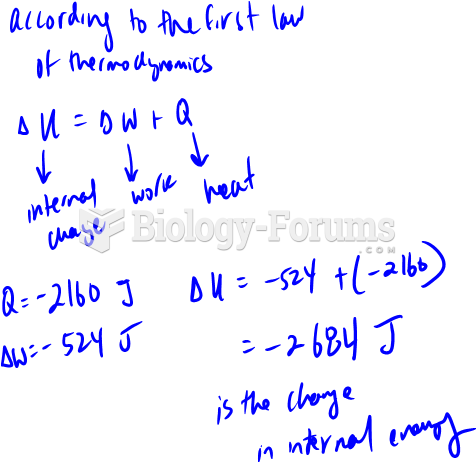 An automobile engine provides 524 Joules of work to push the pistons and generates 2160 Joules ...
 I'm Gonna Show You (Original Mix)