|
|
|

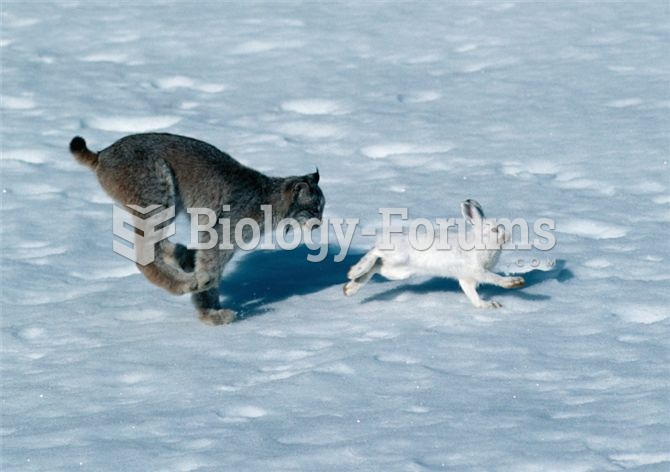 Lynx-hare interactions have served as a model system for the study of the effects o
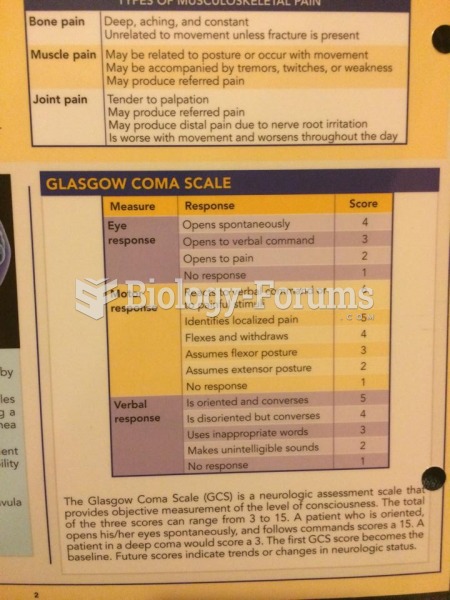 Glascow Coma Scale
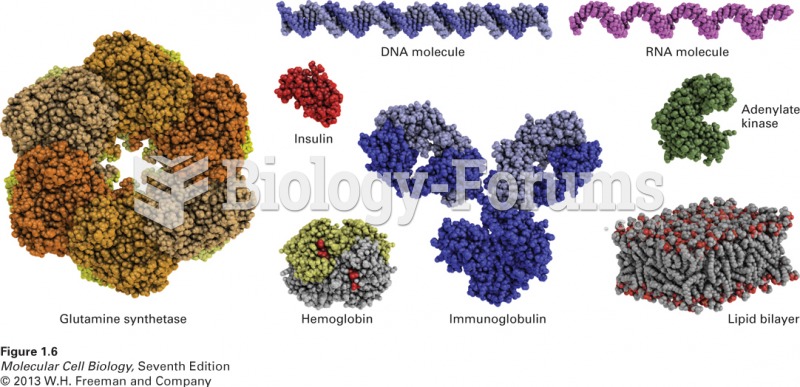 Models of some representative proteins drawn to a common scale
 Student Perspective of Research
 Introduction to Behavioral Research Methods, 6/E
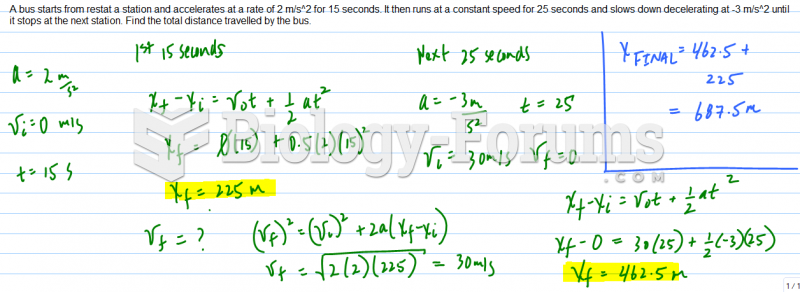 A bus starts from restat a station and accelerates at a rate of 2 m/s^2 for 15 seconds. It then runs