|
|
|

 Exercise increases the heart rate.
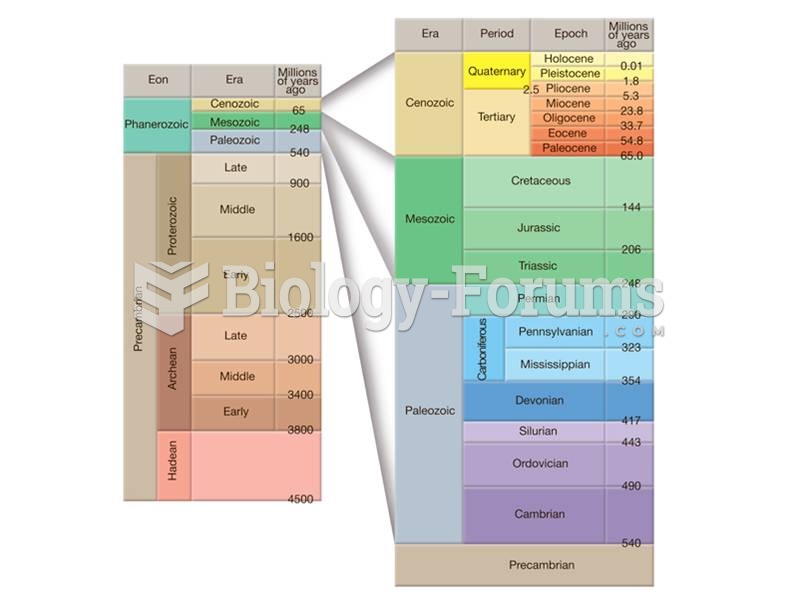 Earth’s history is divided into nested sets of time--eons, eras, periods, and epochs--and is called
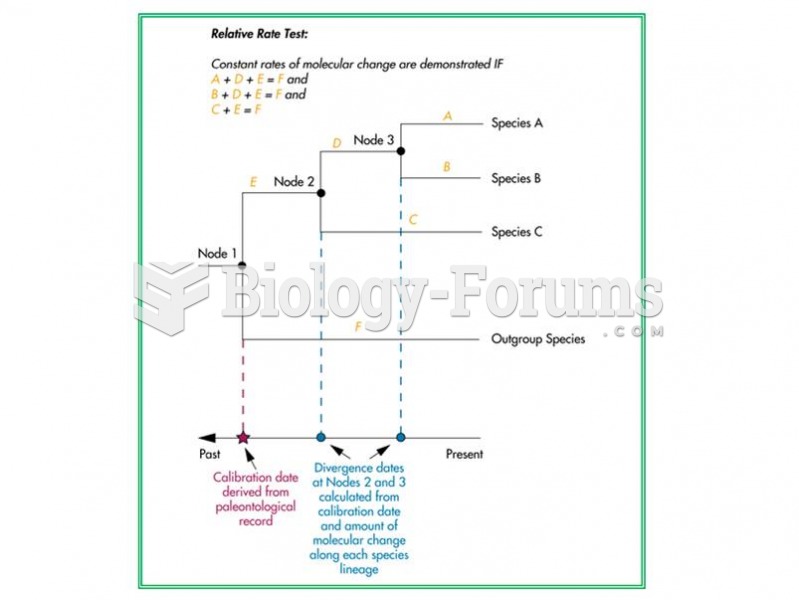 Relative rate test, calibrating the molecular clock, and calculating divergence dates.
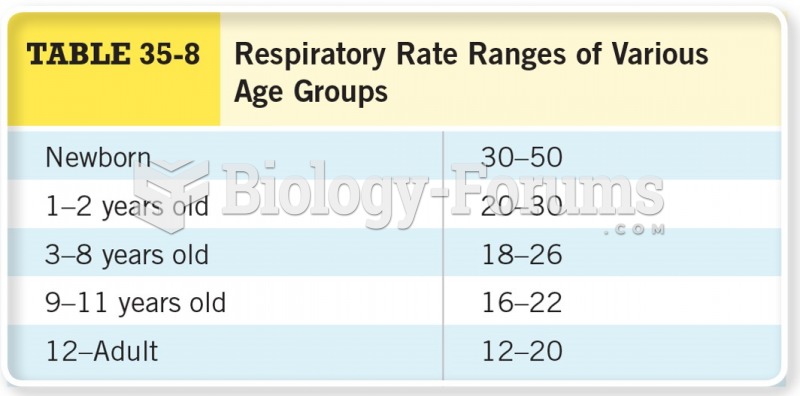 Respiratory Rate Ranges of Various Age Groups
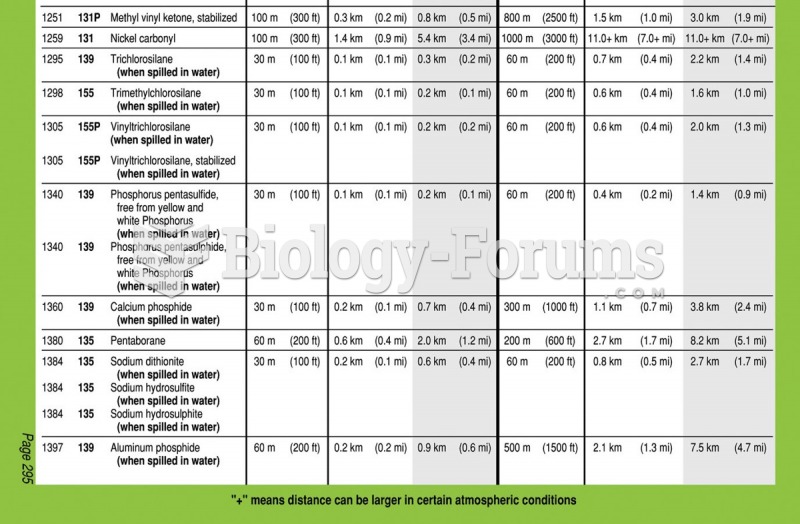 The yellow, blue, and green sections of the Emergency Response Guidebook (ERG). The yellow section ...
 The response of the lac operon in the absence of lactose