|
|
|

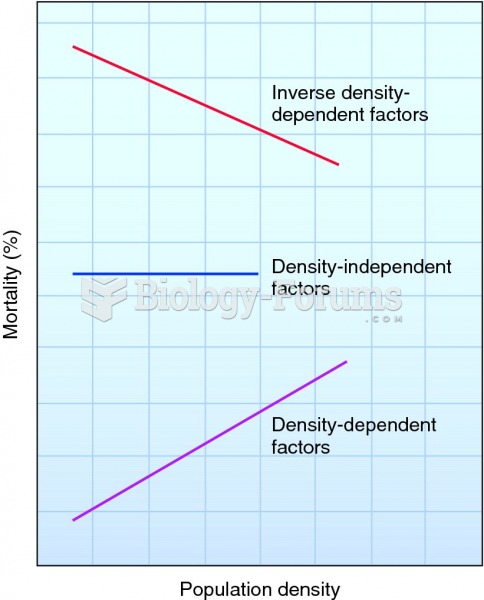 Three ways that factors affect mortality in response to changes in population density.
 Berko’s Language Study
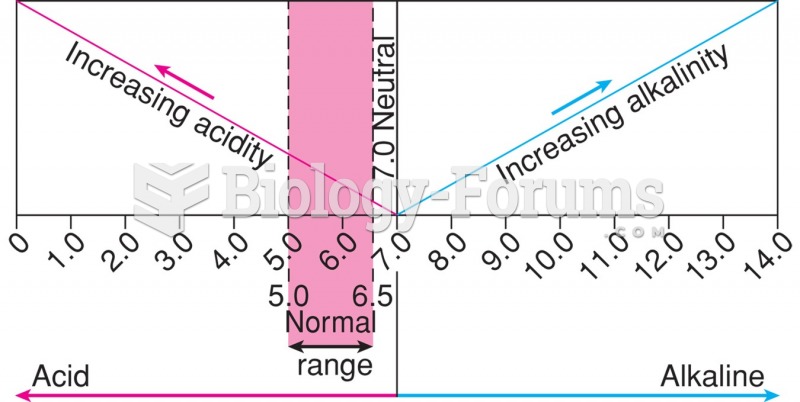 Urine pH scale.
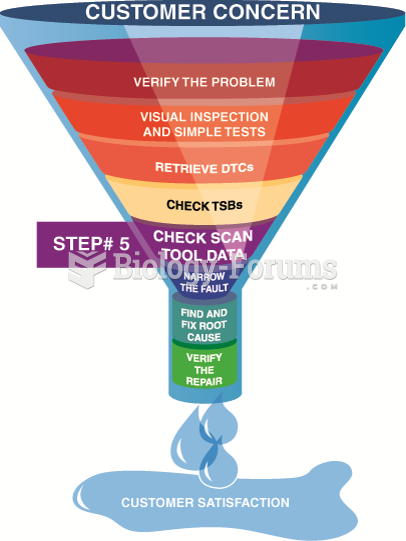 Looking carefully at the scan tool data is very helpful in locating the source of a problem.
 The yellow, blue, and green sections of the Emergency Response Guidebook (ERG). The yellow section ...
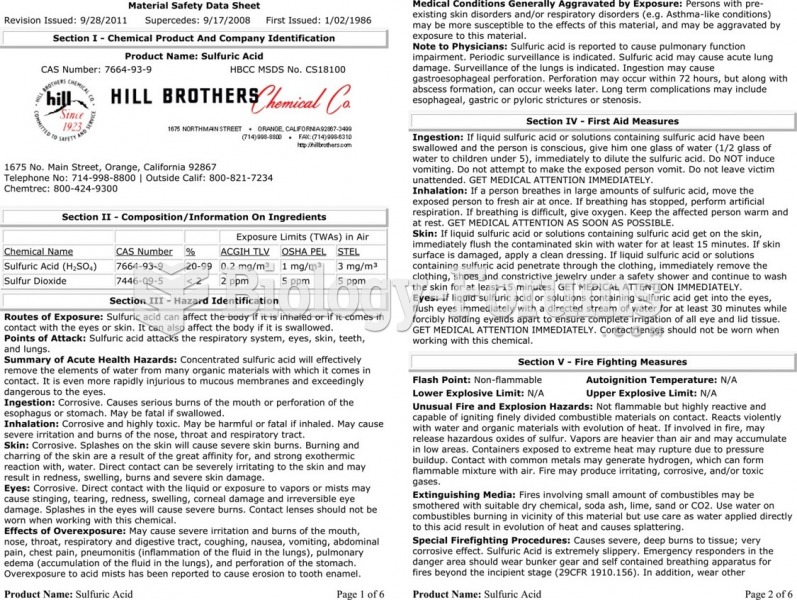 The material safety data sheet (MSDS) for sulfuric acid showing the detailed technical information ...