This topic contains a solution. Click here to go to the answer
|
|
|

 Before starting the process of adjusting the valves, look up the specifications and exact ...
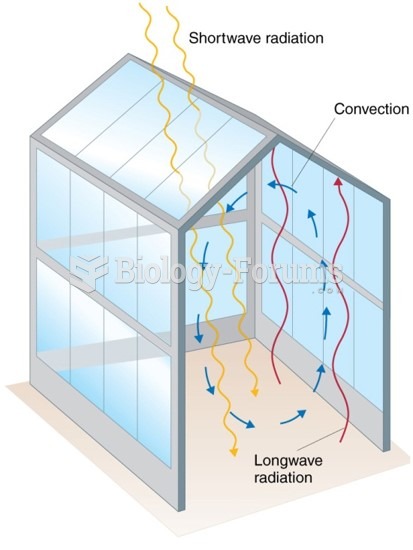 The Greenhouse Effect
 Insolation and the Greenhouse Effect
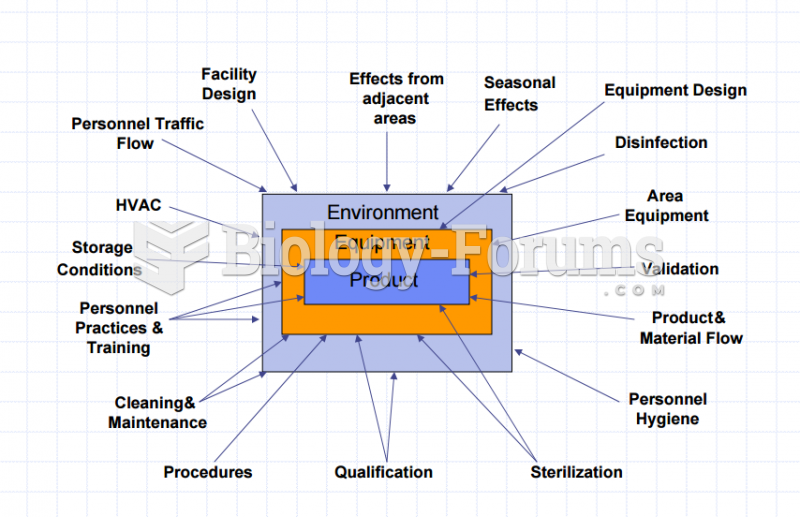 Product & Process Influences - Sterile Products
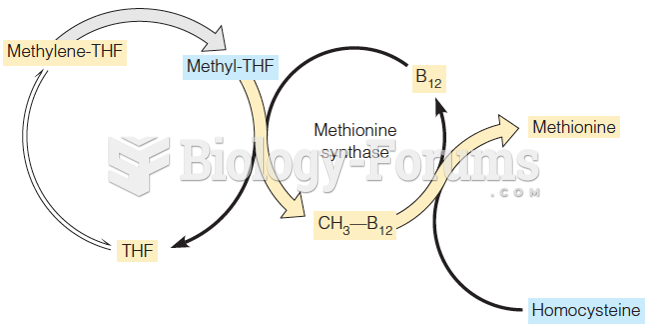 A relationship between folate and B12 metabolism
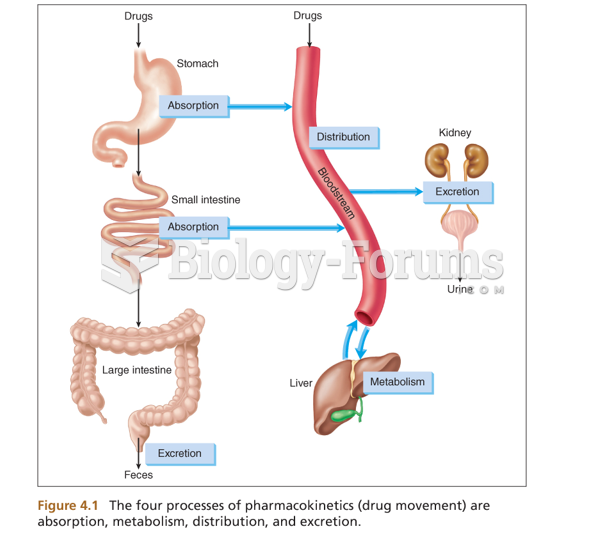 The process of pharmacokinetics