This topic contains a solution. Click here to go to the answer
|
|
|

 This image shows growing blood vessels in the retina of a mouse
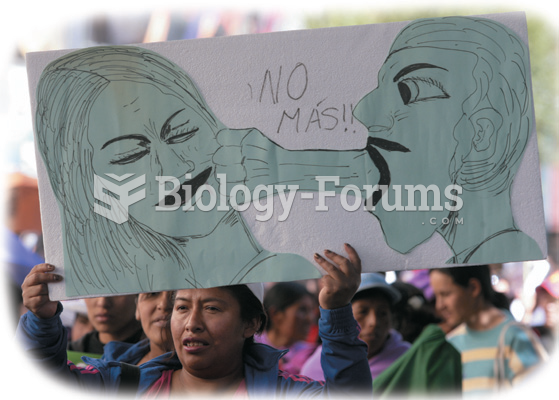
 A nurse shows empathy to a client.
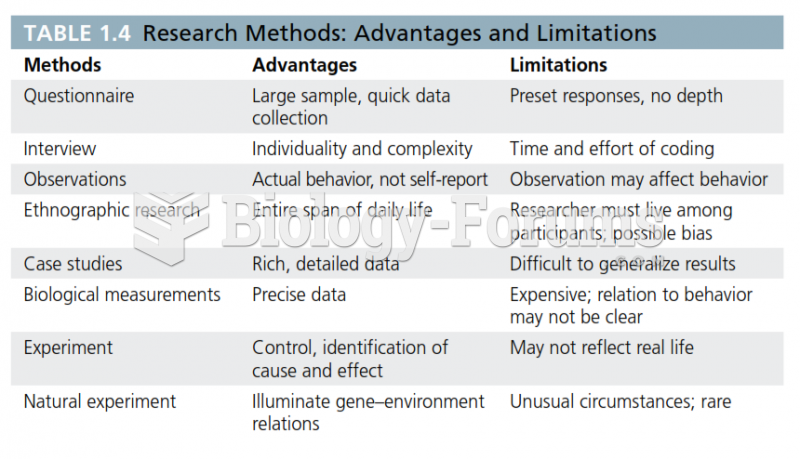 Research Methods: Advantages and Limitations
 The research methods that sociologists choose depend partially on the questions they want to answer. ...
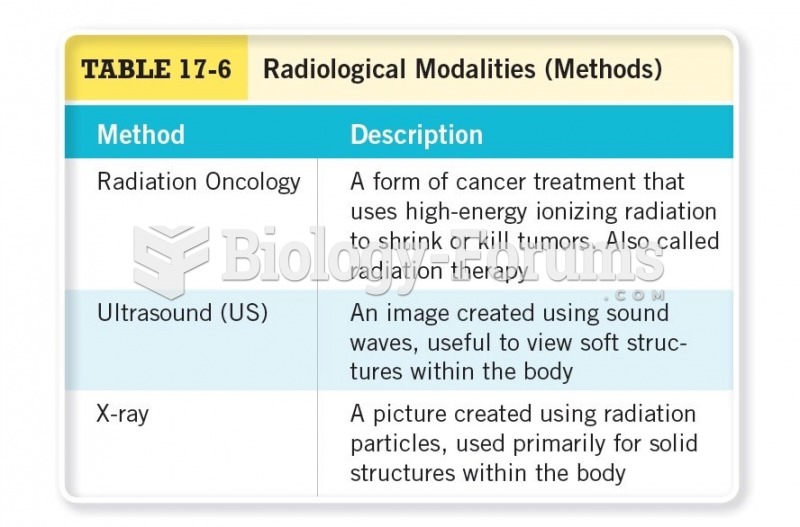 Radiological Modalities (Methods) Cont.
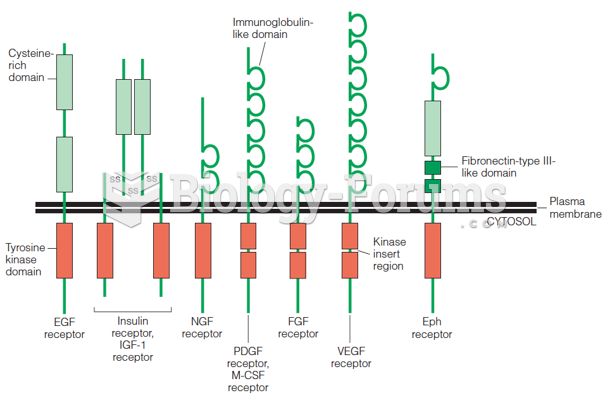 The insulin receptor and its structural relationship to other transmembrane receptors with protein