This topic contains a solution. Click here to go to the answer
|
|
|

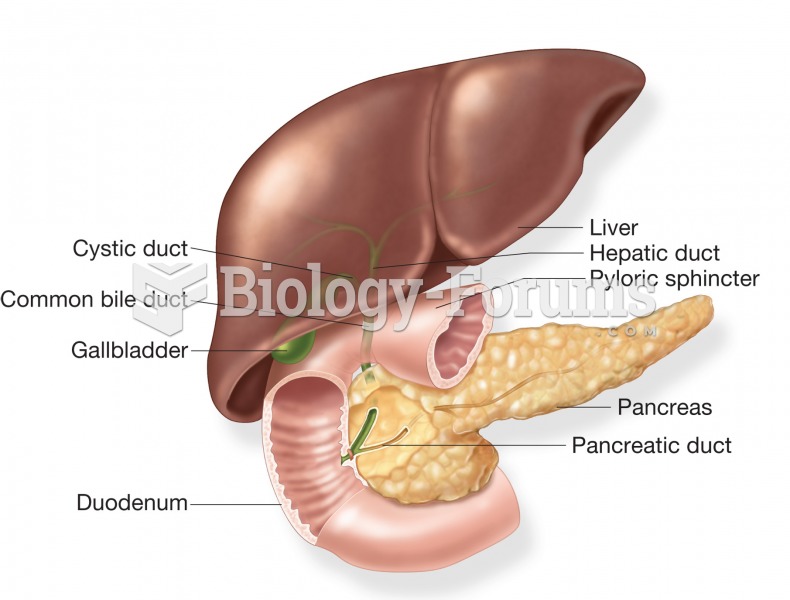 The accessory organs of the digestive system: the liver, gallbladder, and pancreas. Image shows the
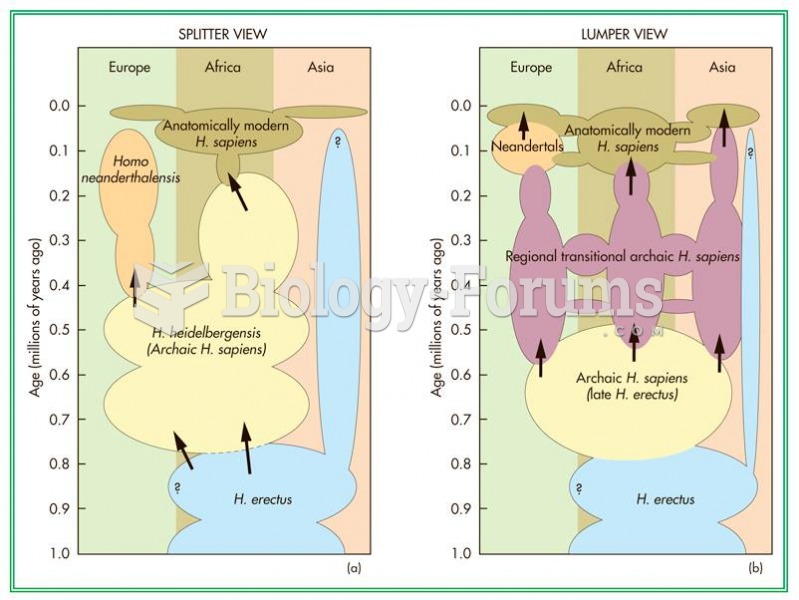 Two views of the phylogenetic relationship between Neandertals and modern H. sapiens.
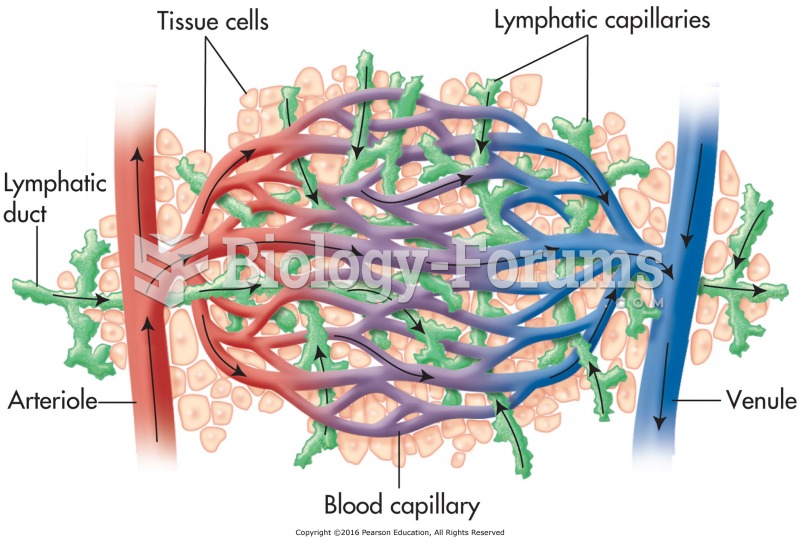 Relationship of the lymphatic system to the cardiovascular system.
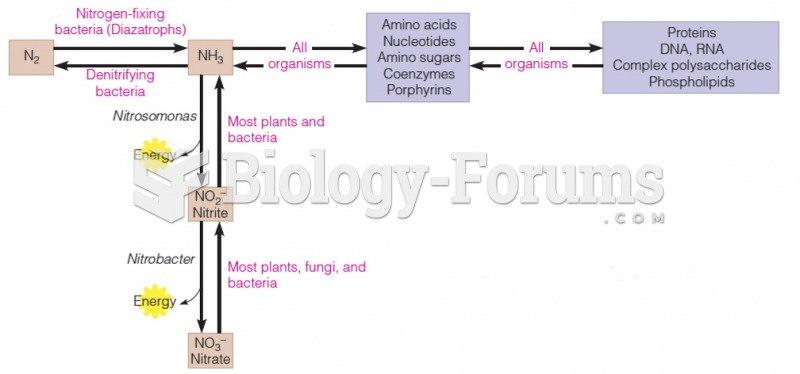 Relationship between inorganic and organic nitrogen metabolism
 Relationship between Income per Capita and Population Growth
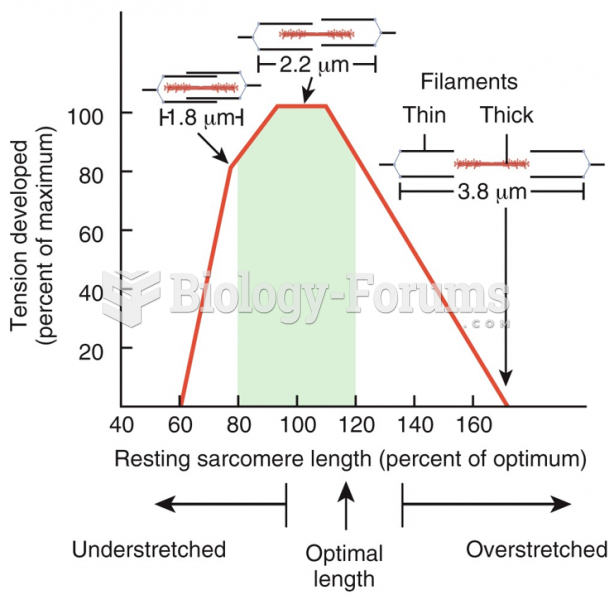 Length-Tension Relationship