This topic contains a solution. Click here to go to the answer
|
|
|

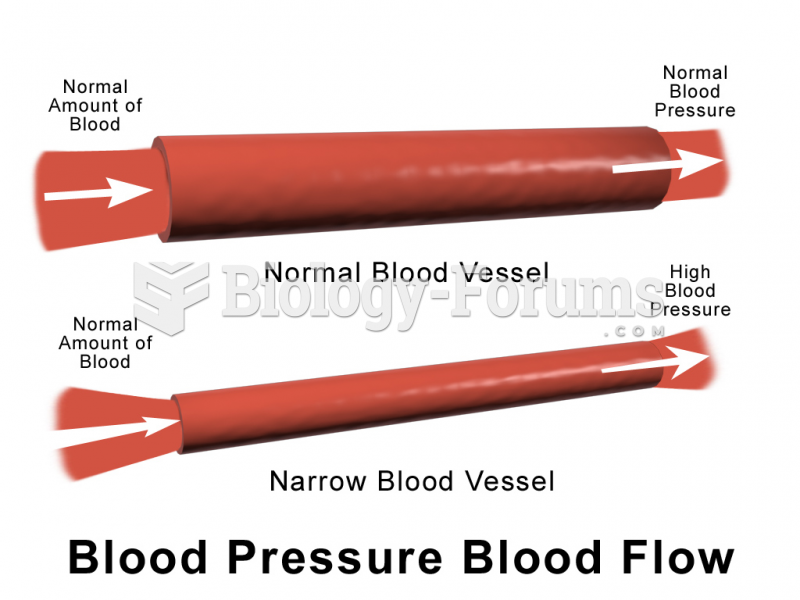 Blood pressure and blood volume relationship
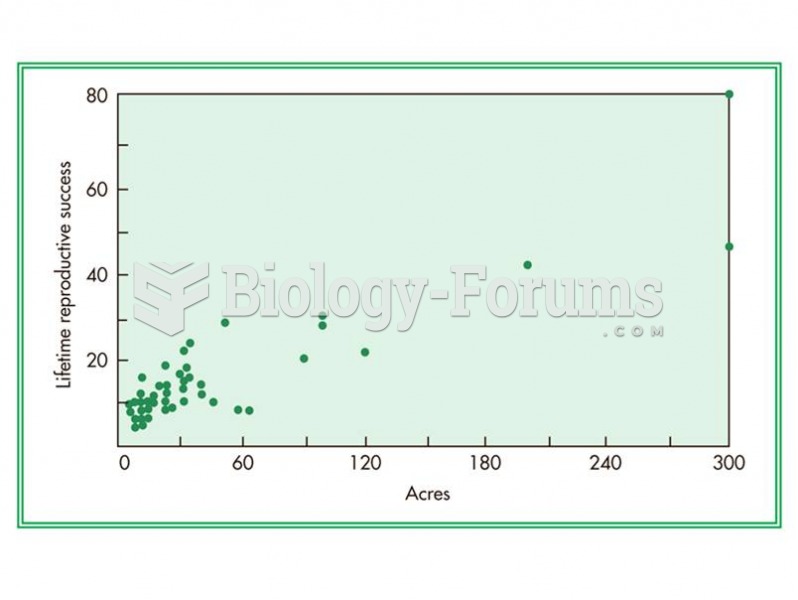 The relationship between number of acres a Kipsigis man owns and the number of offspring he has duri
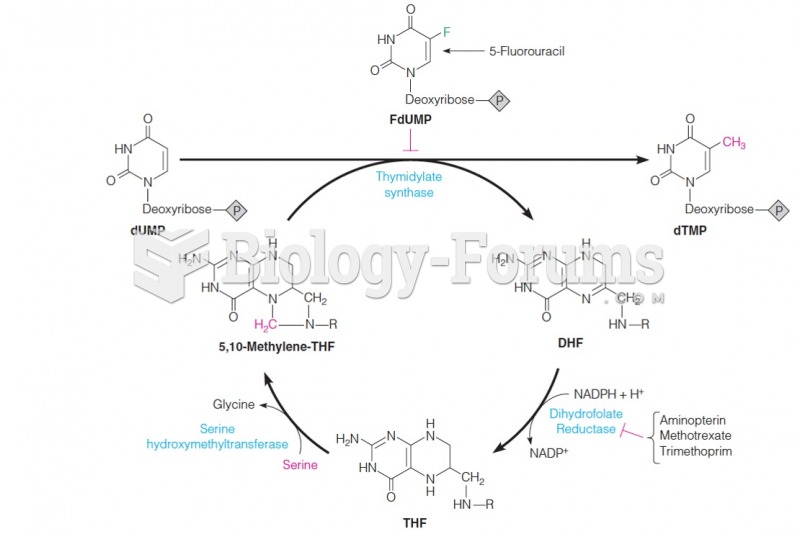 Relationship between thymidylate synthase and enzymes of tetrahydrofolate metabolism
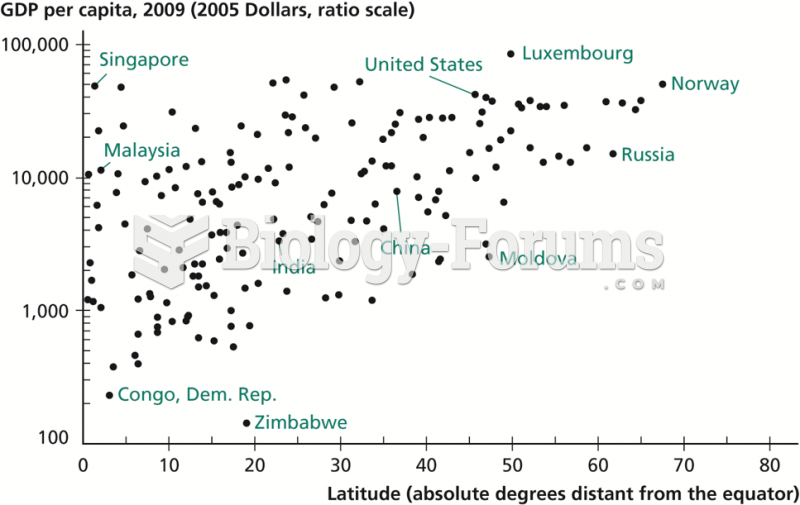 Relationship between Latitude and Income per Capita
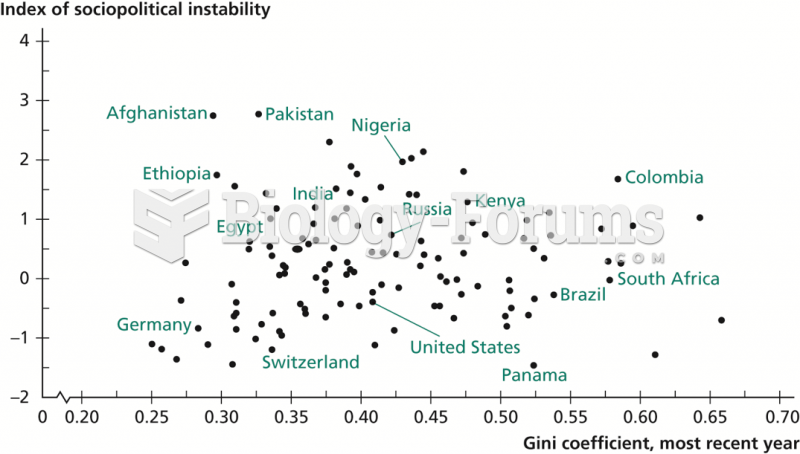 Relationship between Income Inequality and Sociopolitical Instability
 Quantitative trait locus (QTL) detection and mapping