This topic contains a solution. Click here to go to the answer
|
|
|

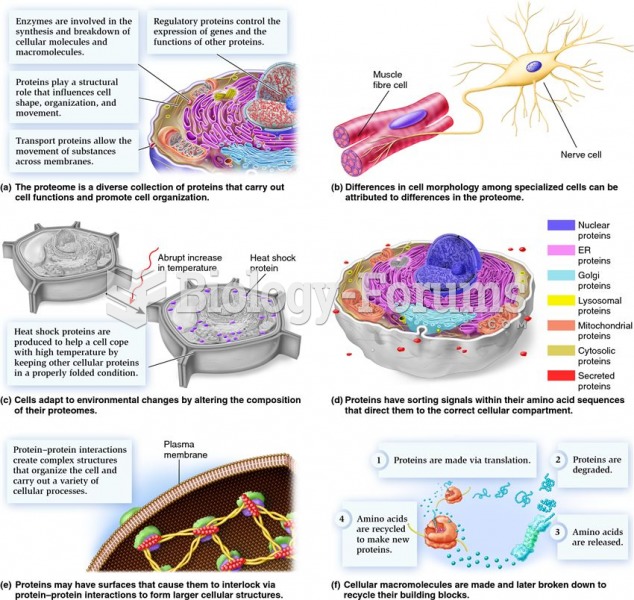 Proteomes and their relationship to cell structure, function, and organization.
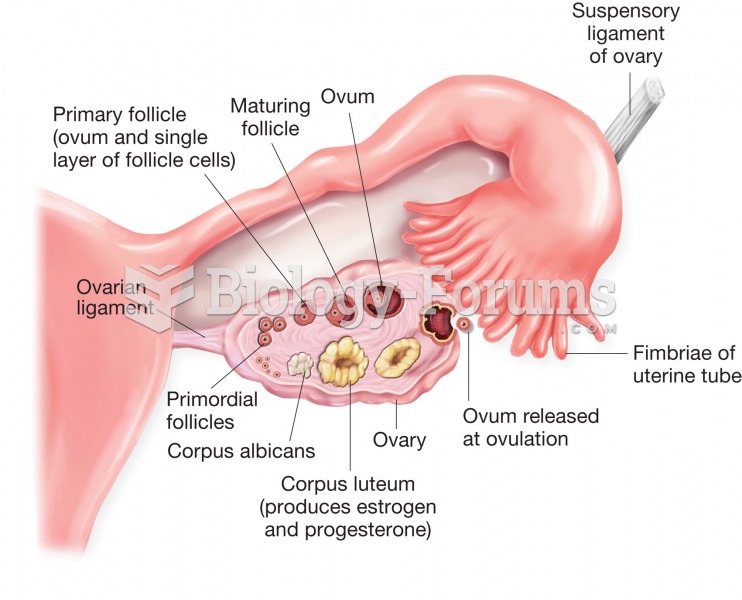 Structure of the ovary and uterine (fallopian) tube. Figure illustrates stages of ovum development a
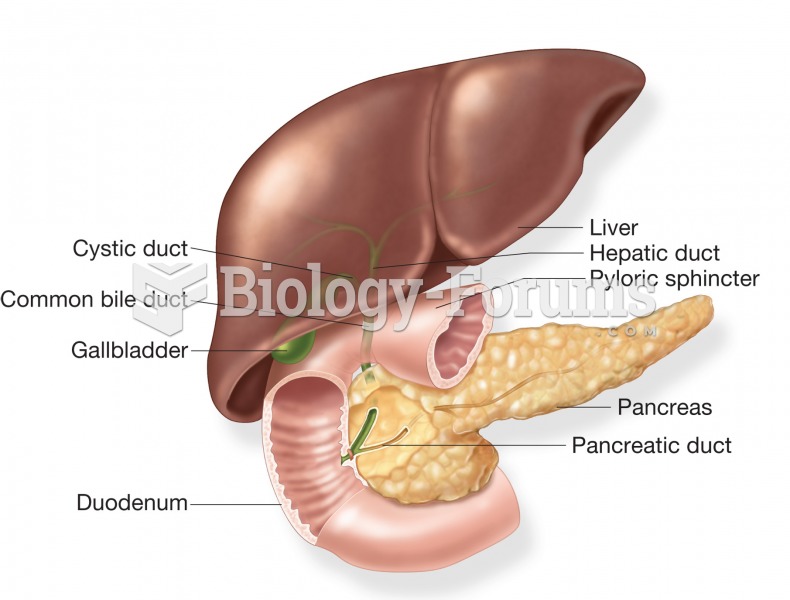 The accessory organs of the digestive system: the liver, gallbladder, and pancreas. Image shows the
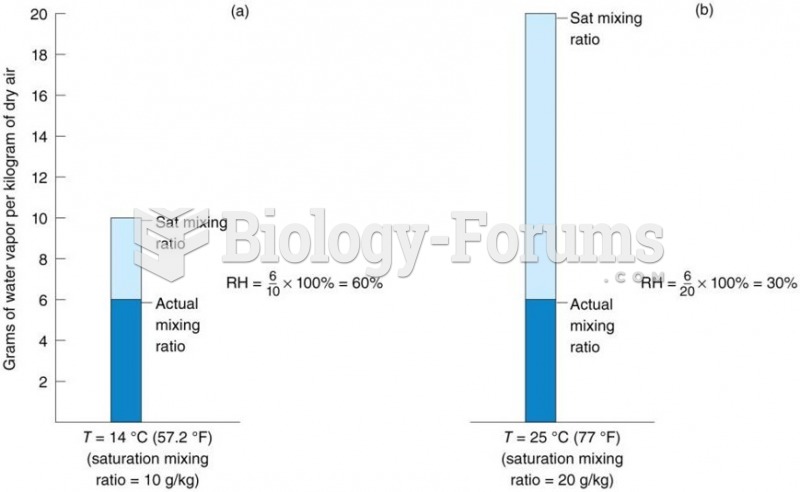 The relationship between RH and temperature.
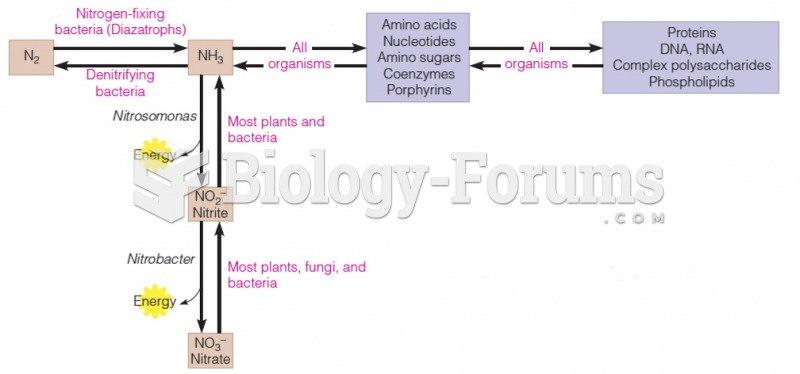 Relationship between inorganic and organic nitrogen metabolism
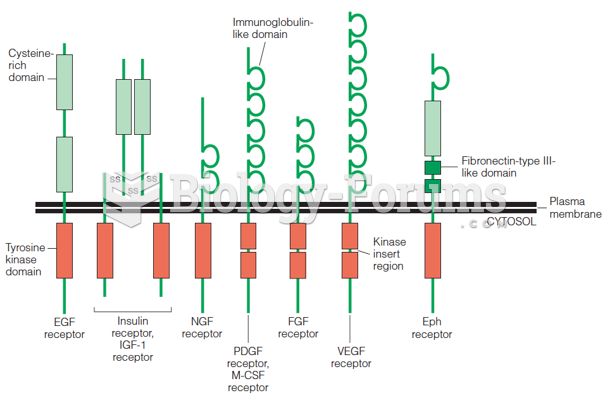 The insulin receptor and its structural relationship to other transmembrane receptors with protein