The most common graphical presentation of quantitative data is a
a. histogram.
b. bar chart.
c. stem and leaf display.
d. pie chart.
Question 2
All of the following are true about qualitative forecasting methods except
a. They generally involve the use of expert judgment to develop forecasts.
b. They assume the pattern of the past will continue into the future.
c. They are appropriate when past data on the variable being forecast are not applicable.
d. They are appropriate when past data on the variable being forecast are not available.

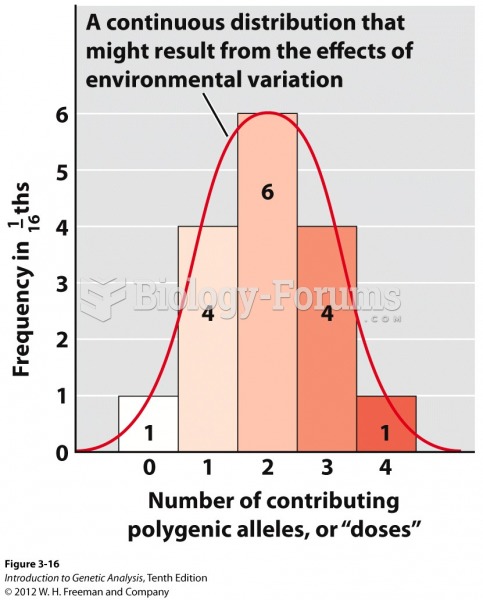 Histogram of polygenes from a dihybrid self
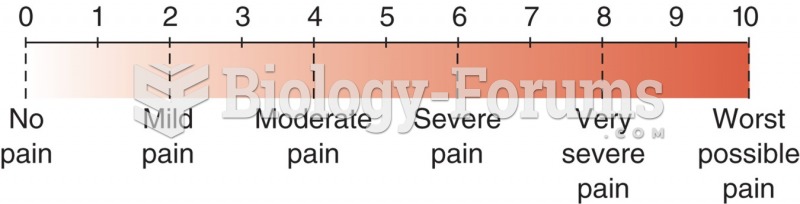 Numerical pain level chart with word modifiers.
 Common Cytochrome P450 Drug Interactions in Dentistry
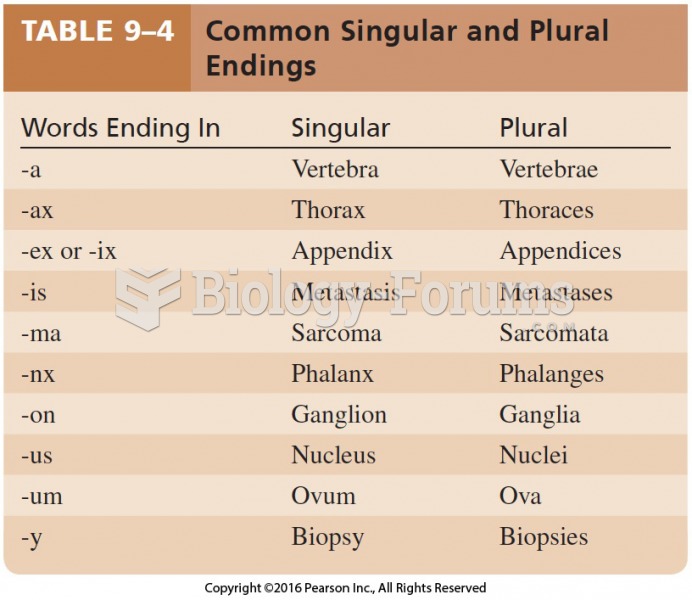 Common Singular and Plural Endings
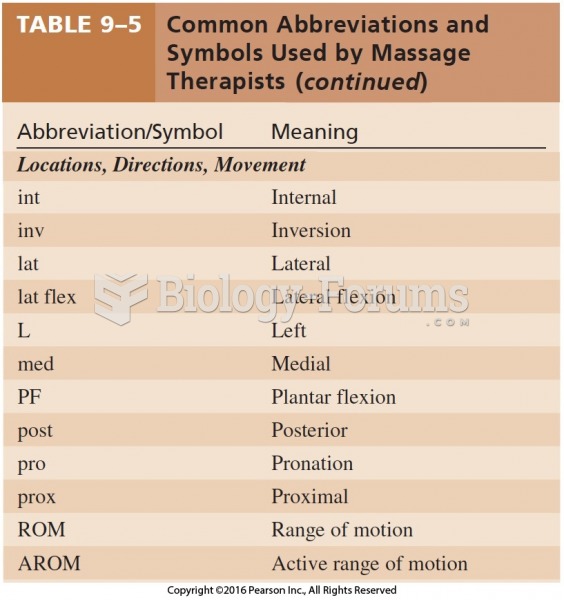 Common Abbreviations and Symbols Used by Massage Therapists Cont