The most common graphical presentation of quantitative data is a
a. histogram.
b. bar chart.
c. stem and leaf display.
d. pie chart.
Question 2
All of the following are true about qualitative forecasting methods except
a. They generally involve the use of expert judgment to develop forecasts.
b. They assume the pattern of the past will continue into the future.
c. They are appropriate when past data on the variable being forecast are not applicable.
d. They are appropriate when past data on the variable being forecast are not available.

 The Pleiades, an open cluster of stars in the constellation of Taurus. These stars share a common mo
 The b-galactosdase chart
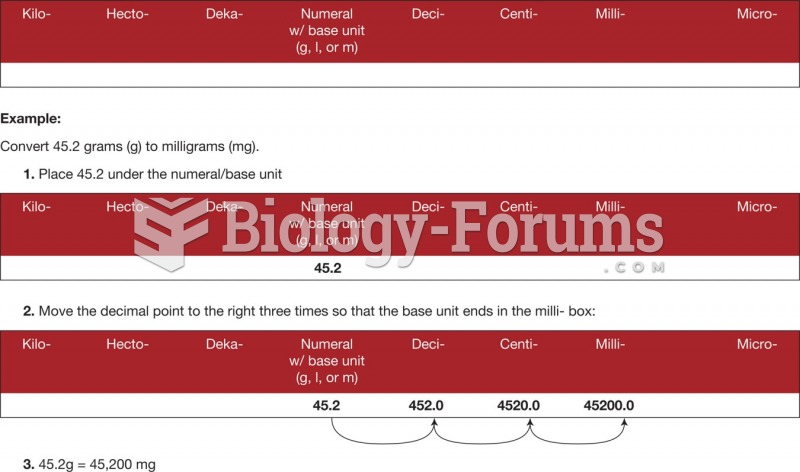 Metric conversion using the place value chart.
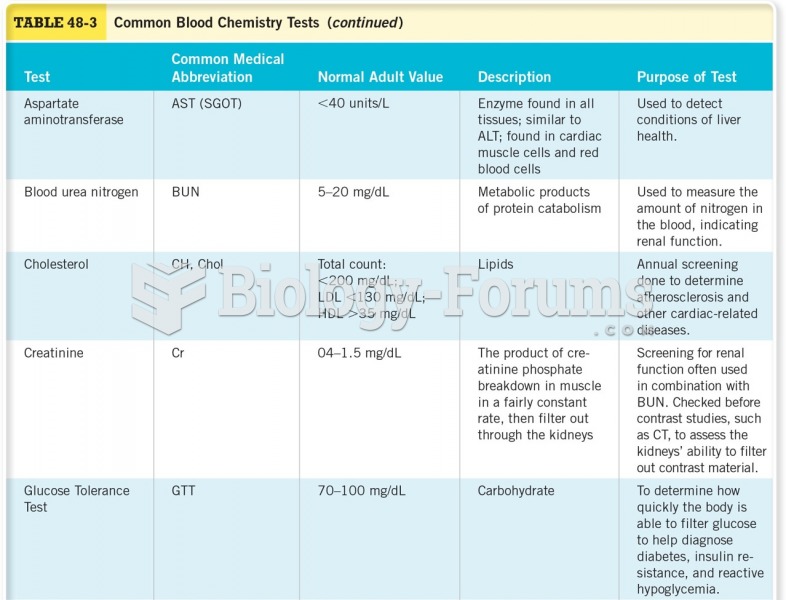 Common Blood Chemistry Tests
 Business Intelligence, Analytics, and Data Science: A Managerial Perspective, 4th Edition
 Common restriction enzymes, with their recognition sequence, DNA cutting patterns, and sources