|
|
|

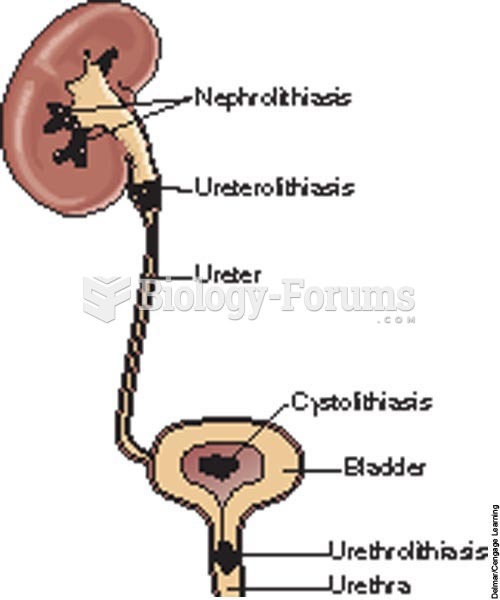 Common locations of urinary calculi formation.
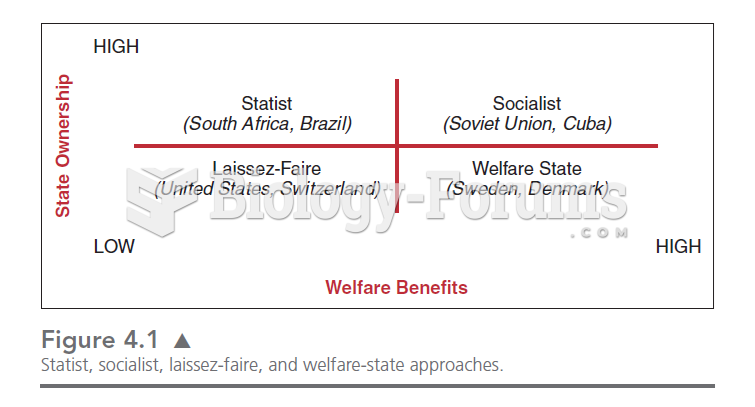 This chart illustrates the four quadrants in which we can place the relationships between the state
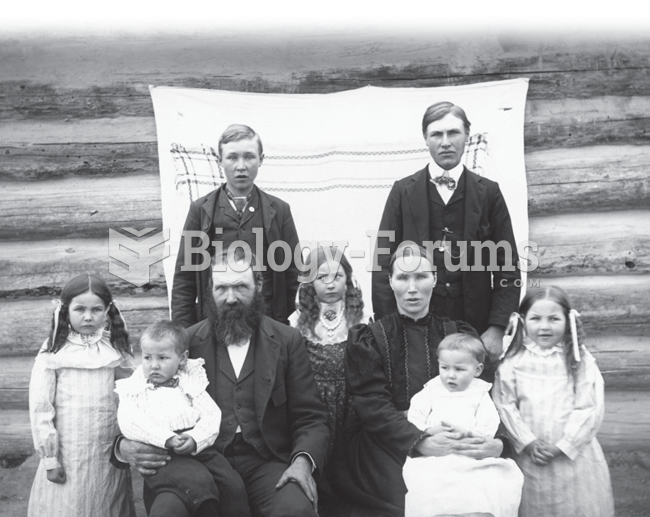 Large families on U.S. farms used to be common. Children helped plant and harvest crops, take care ...
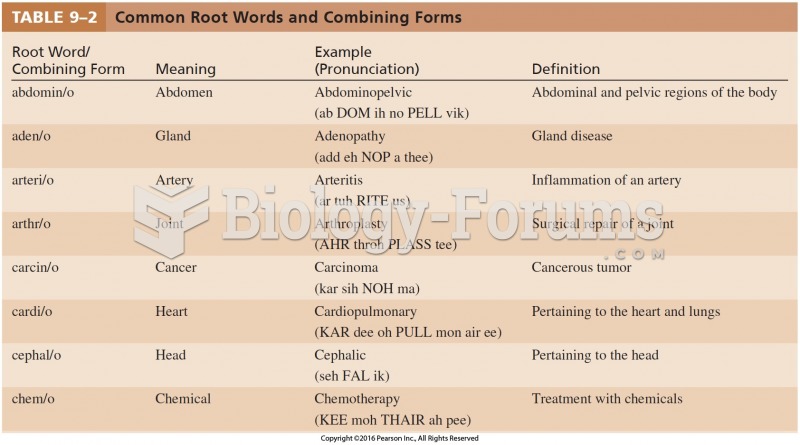 Common Root Words and Combining Forms
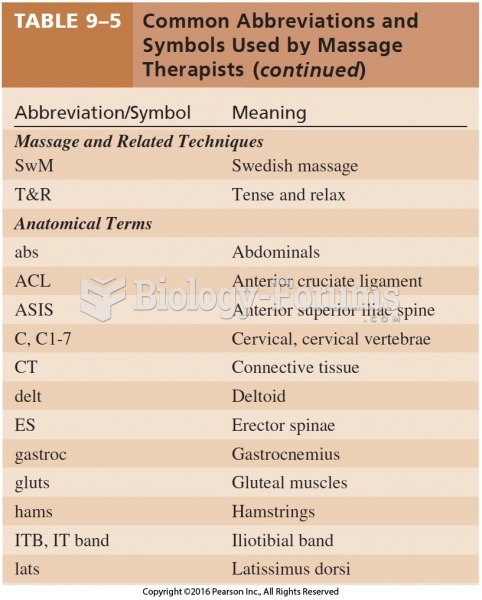 Common Abbreviations and Symbols Used by Massage Therapists Cont
 Data for a Hypothetical Paternity Test Using 13 CODIS Genes