|
|
|

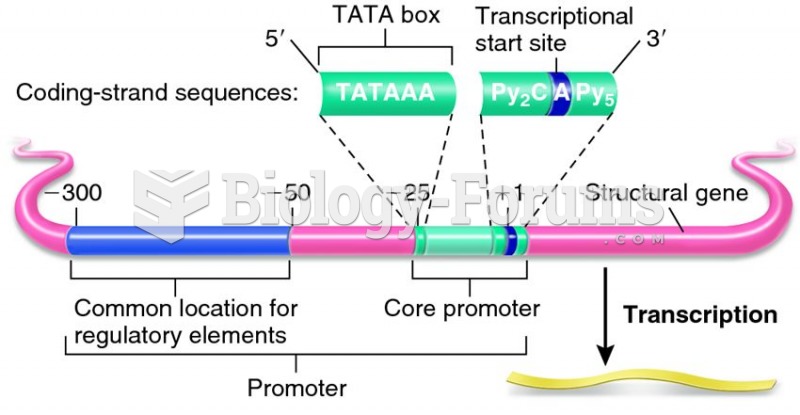 A common organization of sequences for the promoter of a eukaryotic structural gene
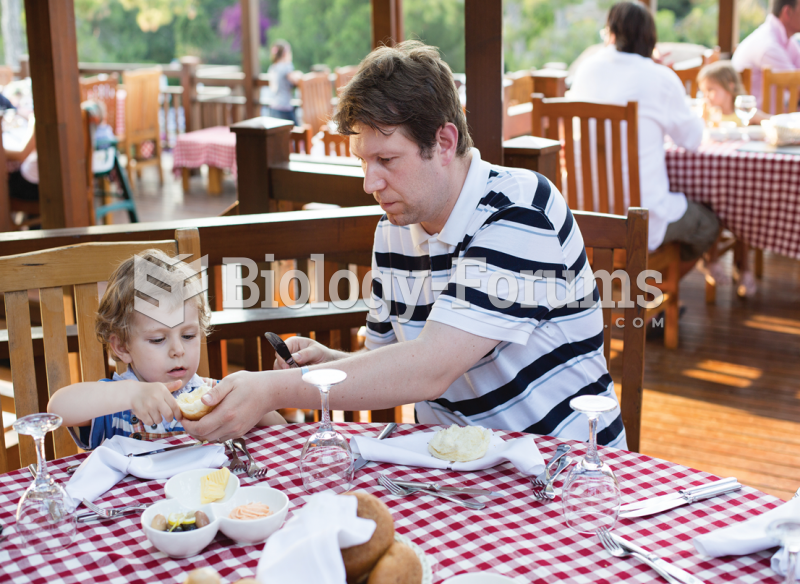 By age 3, children develop scripts for common events such as eating at a restaurant.
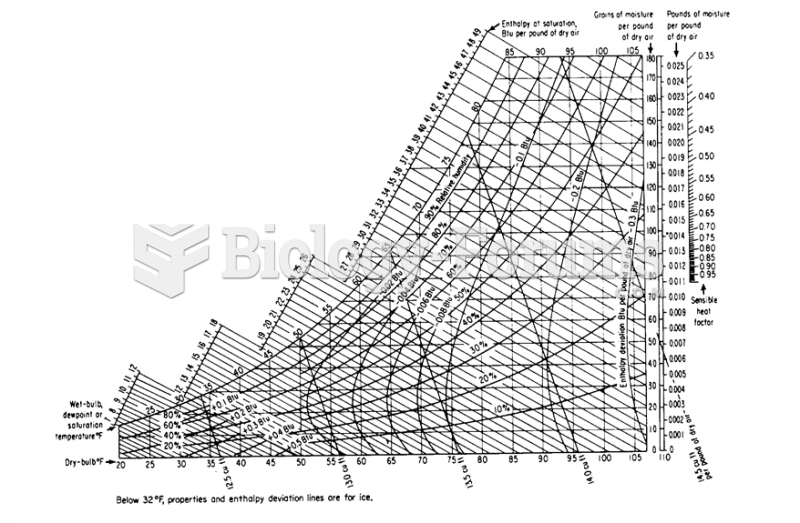 Humidity Chart
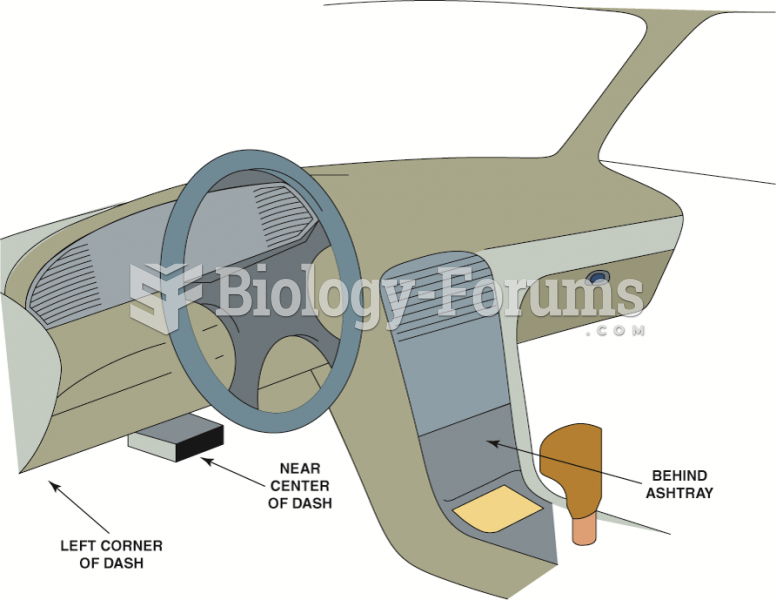 The data link connector (DLC) can be located in various locations.
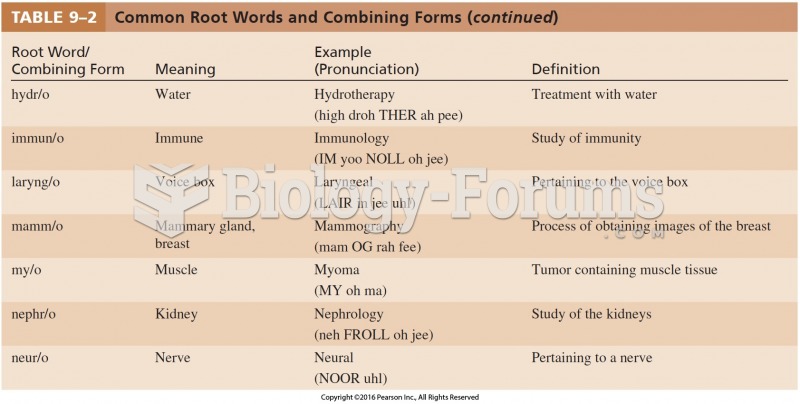 Common Root Words and Combining Forms Cont
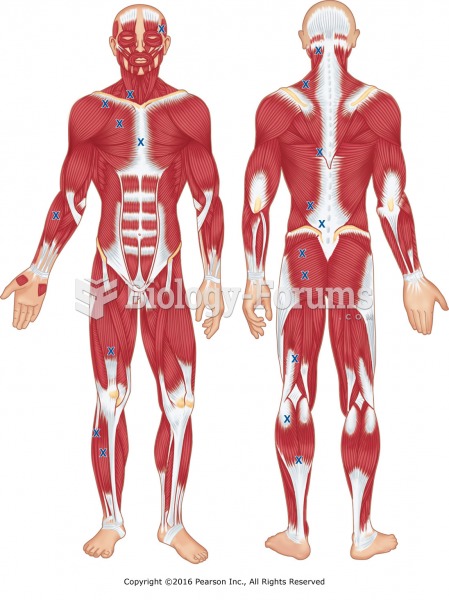 Common trigger point locations, anterior and posterior.