|
|
|

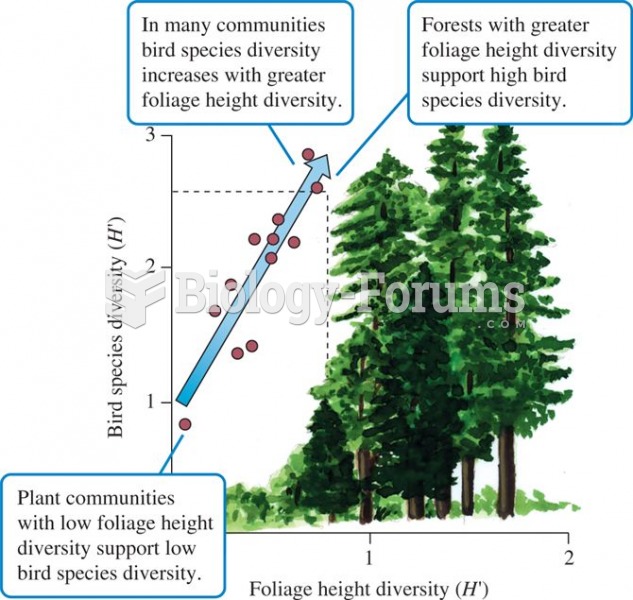 Foliage height diversity and bird species diversity (data from MacArthur and MacArthur 1961).
 Critical thinking involves analysis in which the nurse examines patient data available from a variet
 Common physiological changes with aging
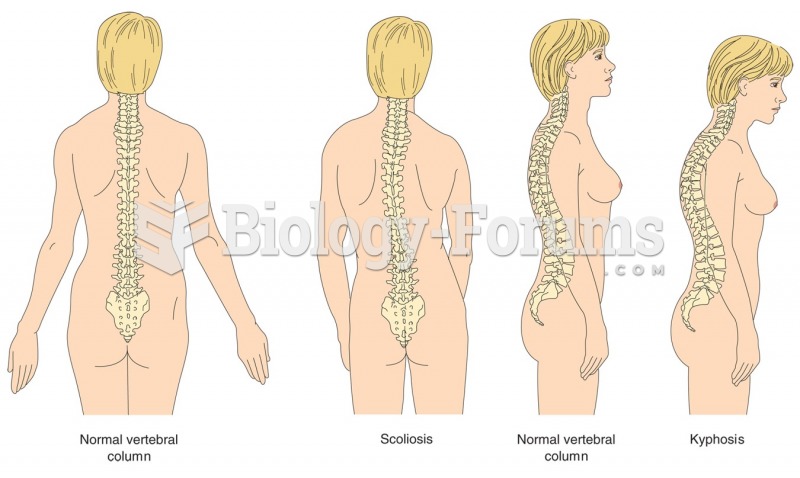 The two most common deformities of the spinal column are scoliosis and kyphosis.
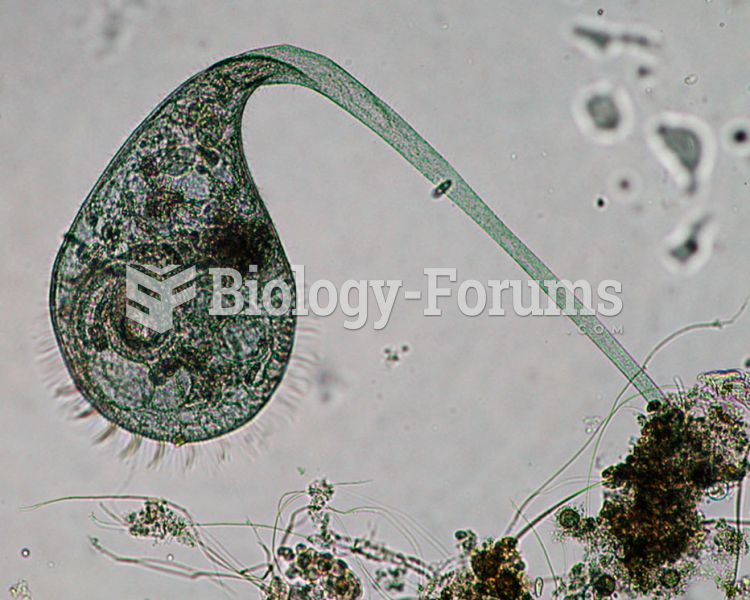 This ciliated protozoan is a Stentor. Stentor are common in freshwater lakes and rivers
 Common Characteristics of the Inheritance of Autosomal Recessive Traits Seen in Pedigrees