|
|
|

Did you know?
Methicillin-resistant Staphylococcus aureus or MRSA was discovered in 1961 in the United Kingdom. It if often referred to as a superbug. MRSA infections cause more deaths in the United States every year than AIDS.

 A revised animal phylogeny based on molecular data of SSU rRNA
 Lake position in the landscape and proportion of water received as groundwater (data from Webster et
 An example of a corrected chart notation.
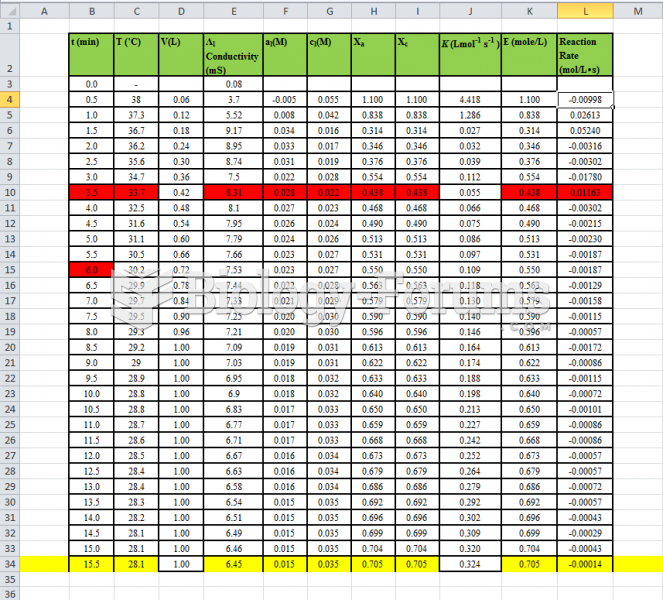 Fluidization - Data Table of experiment
 Chart
Chart
 Survivorship curves. Blue lines are theoretical curves. Red dots are data from field studies.