|
|
|

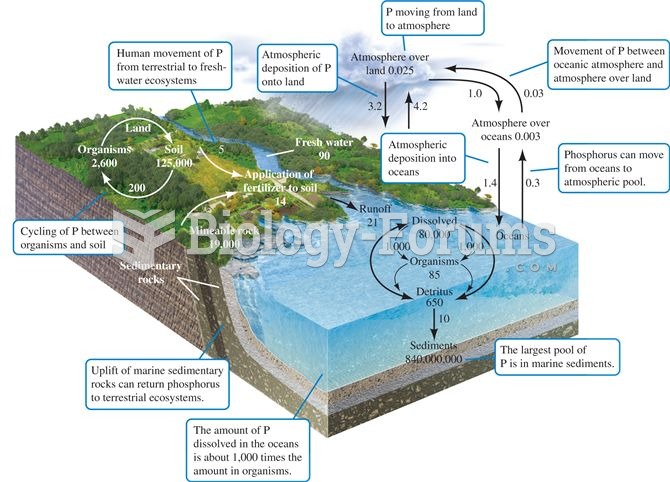 The phosphorus cycle. Numbers are 1012 g P or fluxes as 1012 g P per year (data from Schlesinger 199
 Summary of US Census Data
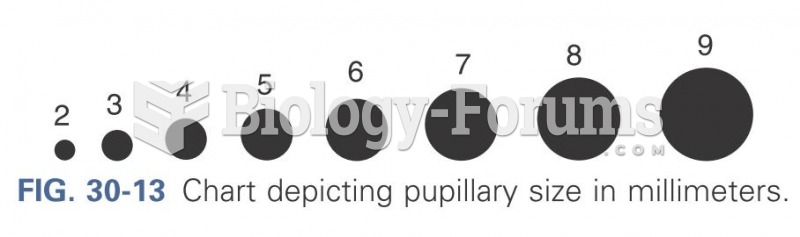 Chart depicting pupillary size in millimeters
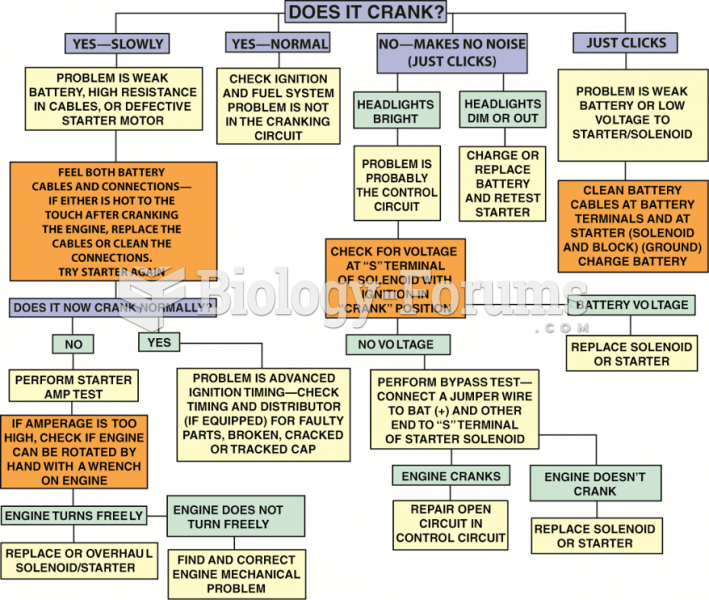 Starter diagnosis chart.
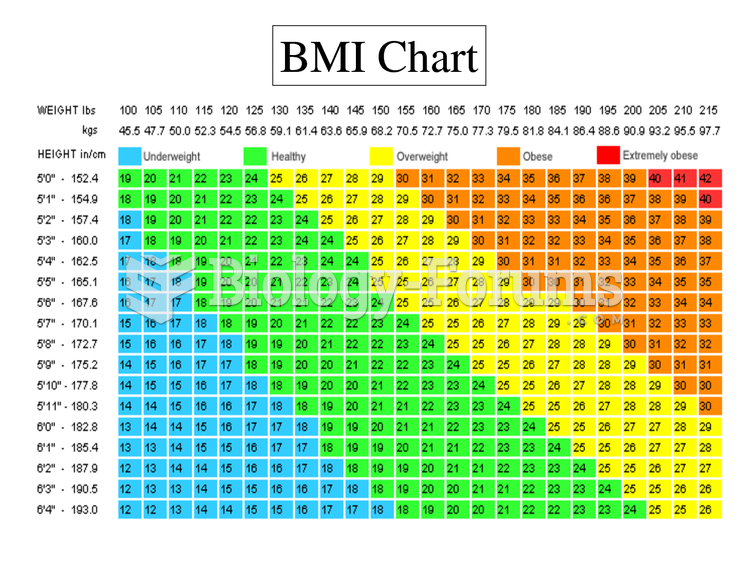 BMI Chart Weight Chart
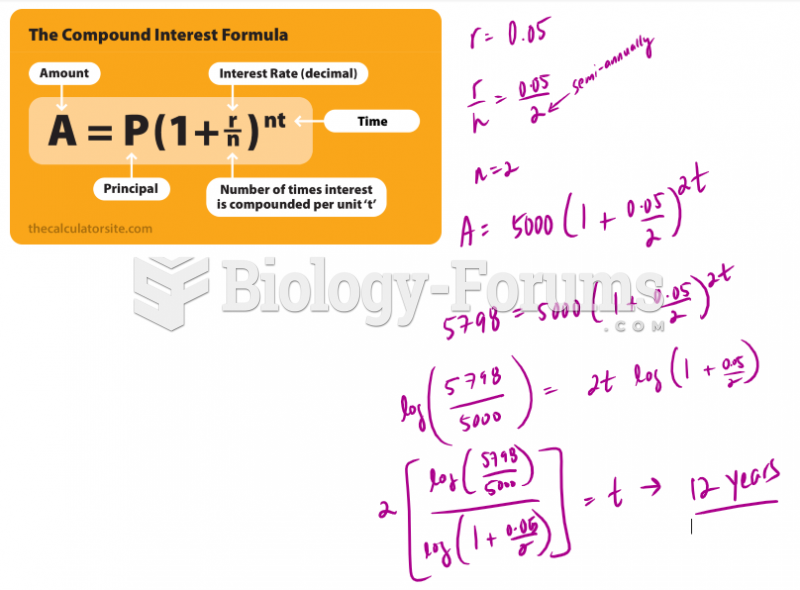 Use a graphical method to find the length of the loan to the nearest year