|
|
|

 A true albino squirrel. Note the pink eyes.
 Critical thinking involves analysis in which the nurse examines patient data available from a variet
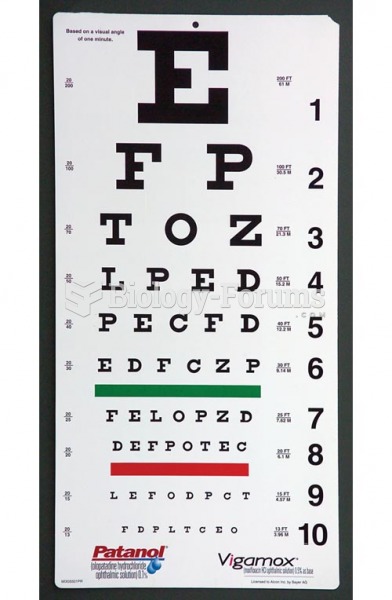 Visual Acuity Testing, Snellen Vision Chart
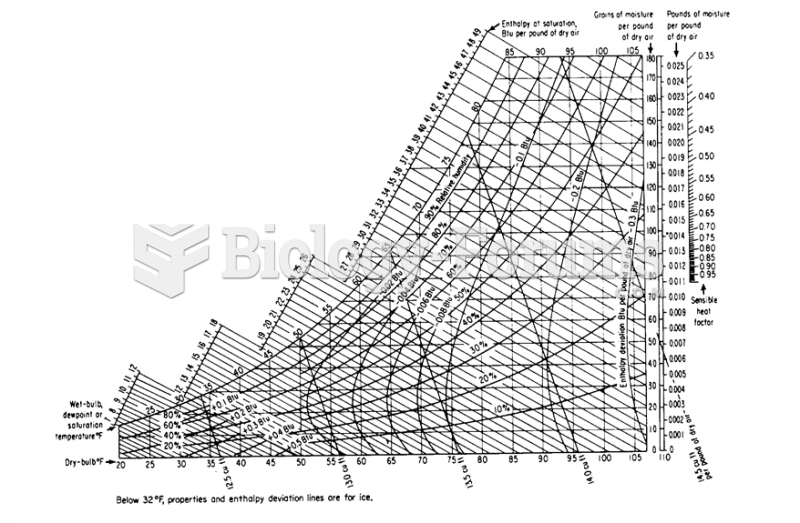 Humidity Chart
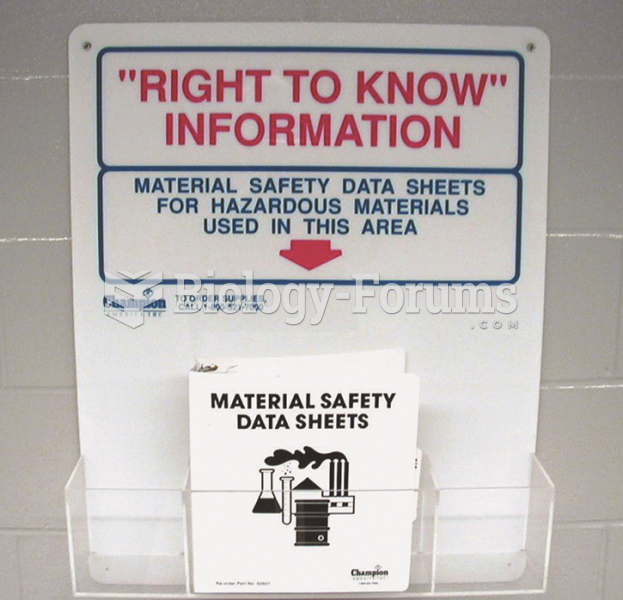 Material safety data sheets (MSDS), now called safety data sheets (SDS), should be readily available ...
 Sketch a graph of the function h(x), by hand on the following interval: