|
|
|

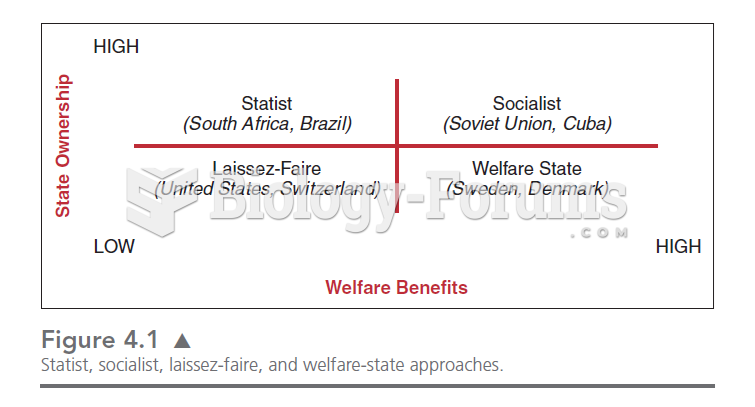 This chart illustrates the four quadrants in which we can place the relationships between the state
 A physician uses a portable electronic tablet to enter patient data while in the examination room.
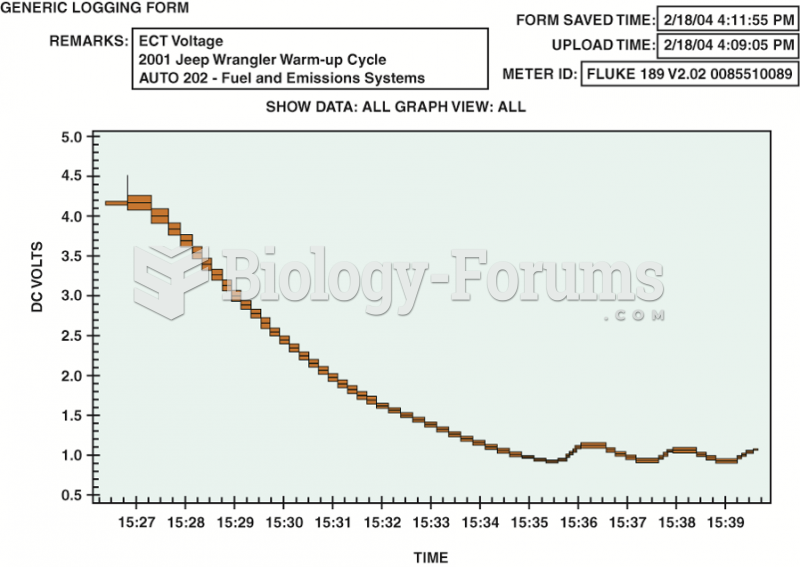 An ECT sensor being tested using a digital meter set to DC volts. A chart showing the voltage ...
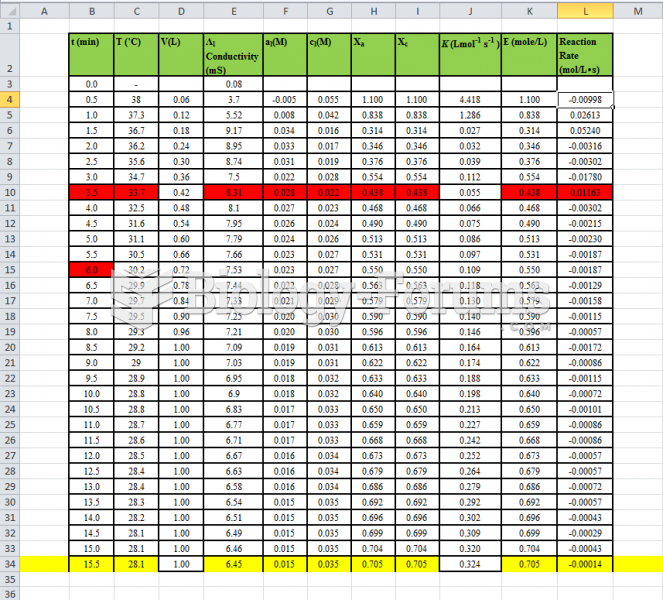 Fluidization - Data Table of experiment
 How to calculate the mean for grouped data
 A 16-input multiplexer is to be used to perform parallel-to-serial data conversion. Which of ...