|
|
|

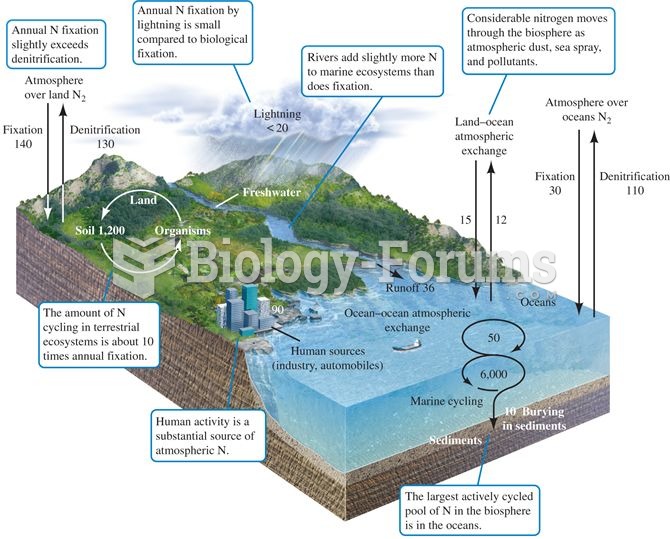 The nitrogen cycle. Numbers represent fluxes as 1012 g N per year (data from Schlesinger 1991, after
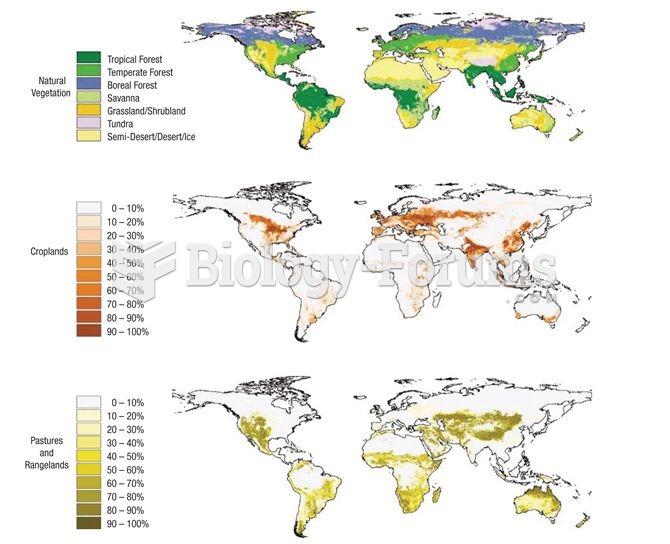 Extent of agricultural activity across the planet (data from Foley et al. 2005).
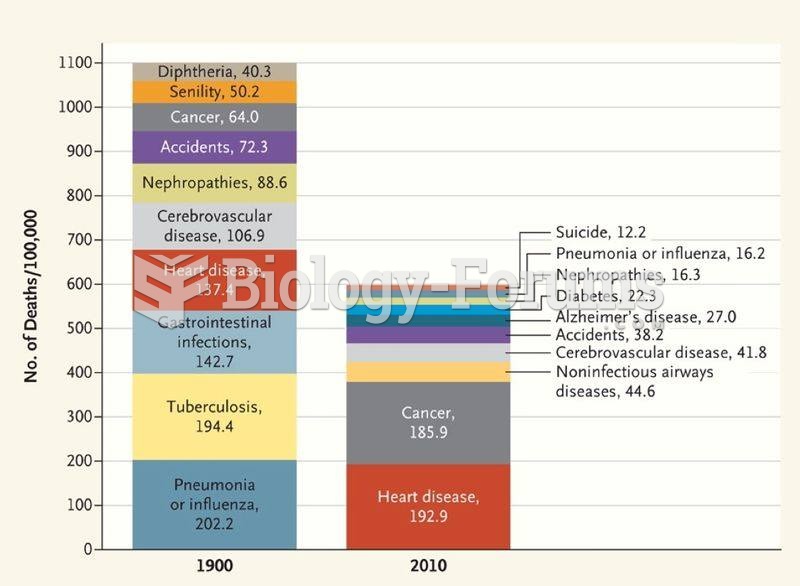 Morbidity chart
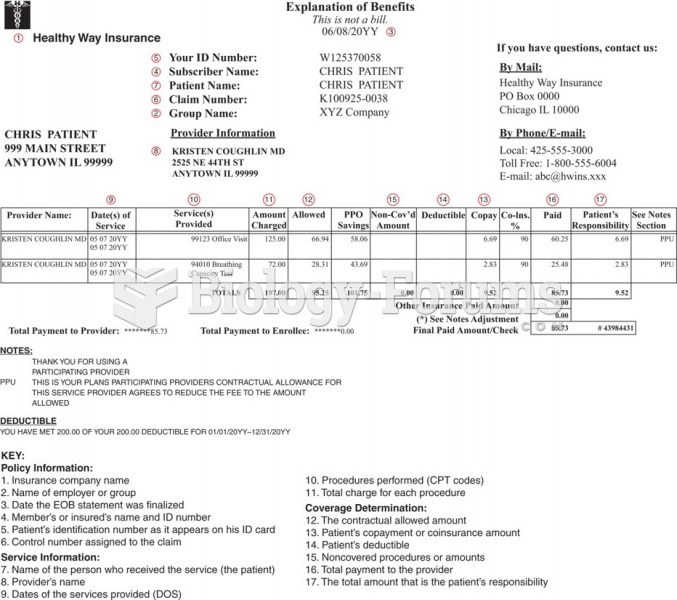 Example of an Explanation of Benefits statement.
 Demographic Data for Nigeria
 E chart for testing distant vision