This topic contains a solution. Click here to go to the answer
|
|
|

 Young adults usually grieve loss of a role, such as employment or the breakup of a relationship.
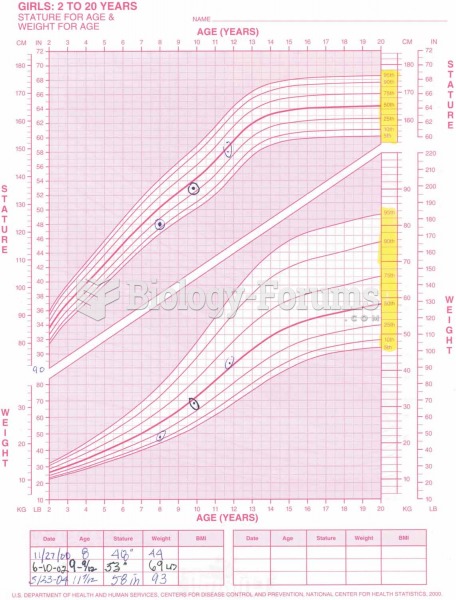 Pediatric growth chart.
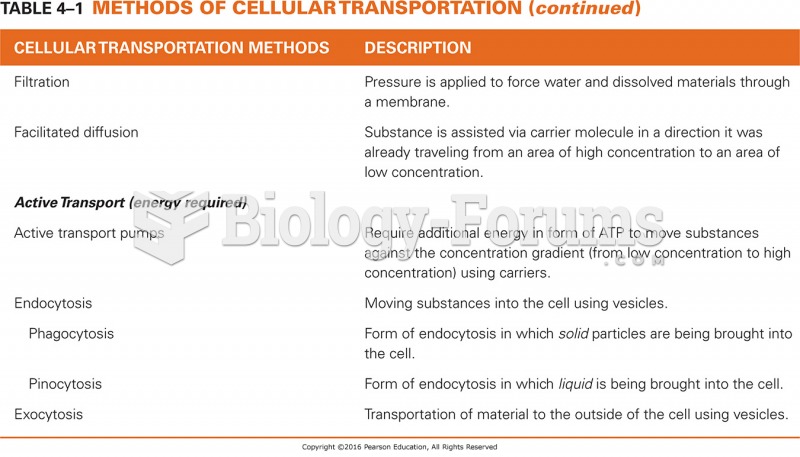 Cellular Transportation Methods
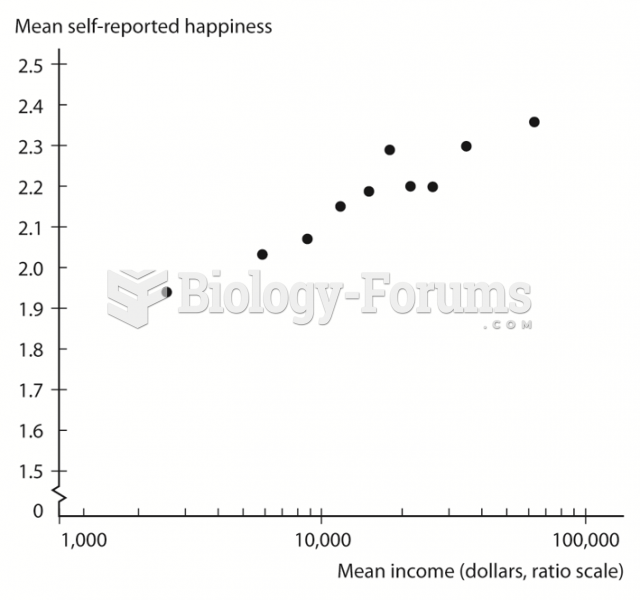 Relationship between Income and Happiness in the United States
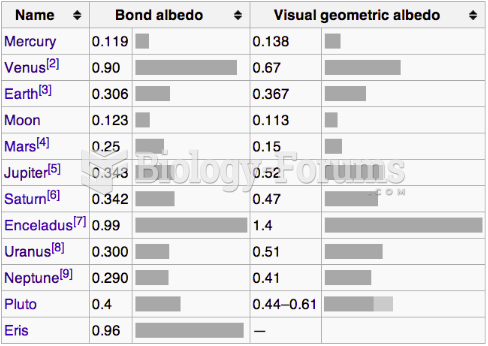 Albedo Chart
 Events in human fertilization. The light micrograph shows a fertilized human oocyte.