This topic contains a solution. Click here to go to the answer
|
|
|

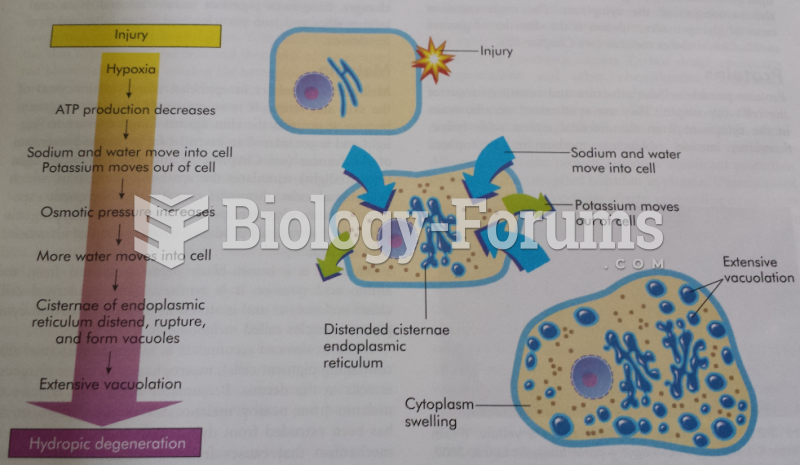 Oncosis Process
 Before starting the process of adjusting the valves, look up the specifications and exact ...
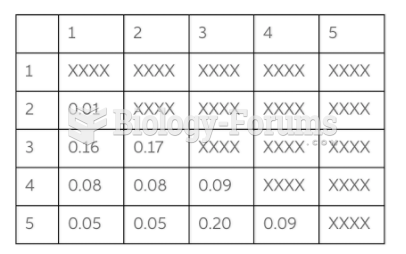 Chart
Chart
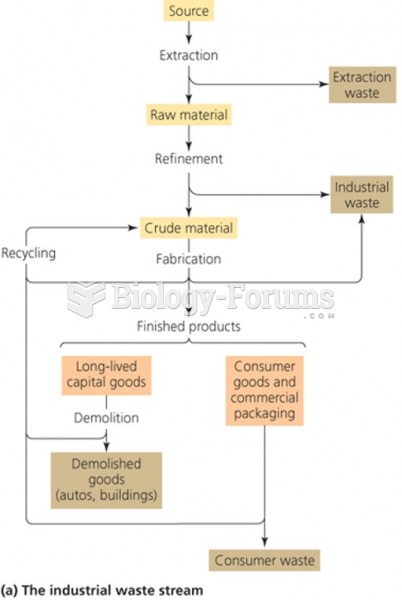 Industrial solid waste process flow diagram
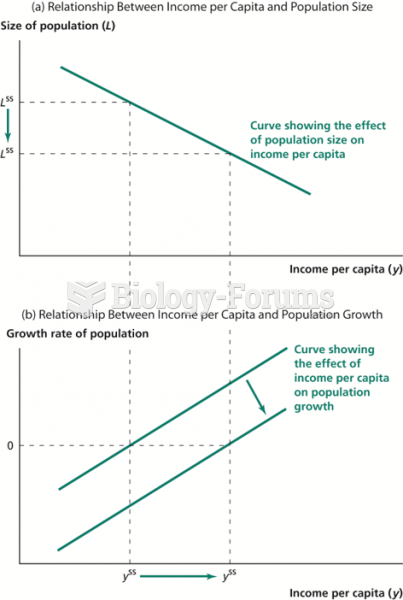 Effect of “Moral Restraint” in the Malthusian Model
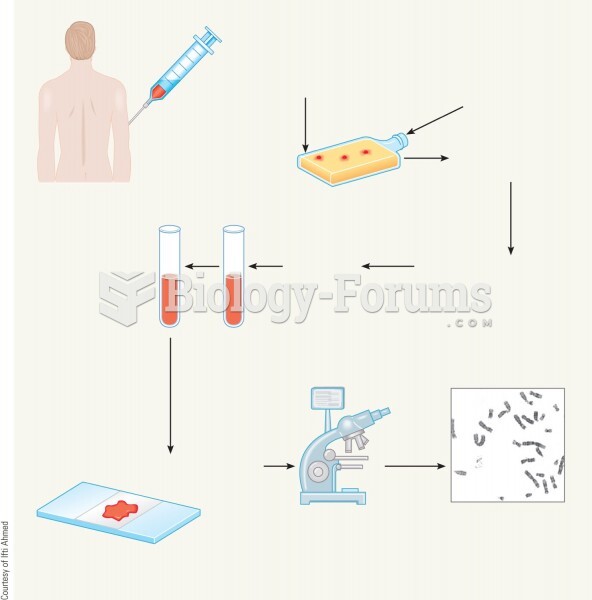 The steps in the process of creating a karyotype for chromosome analysis.