This topic contains a solution. Click here to go to the answer
|
|
|

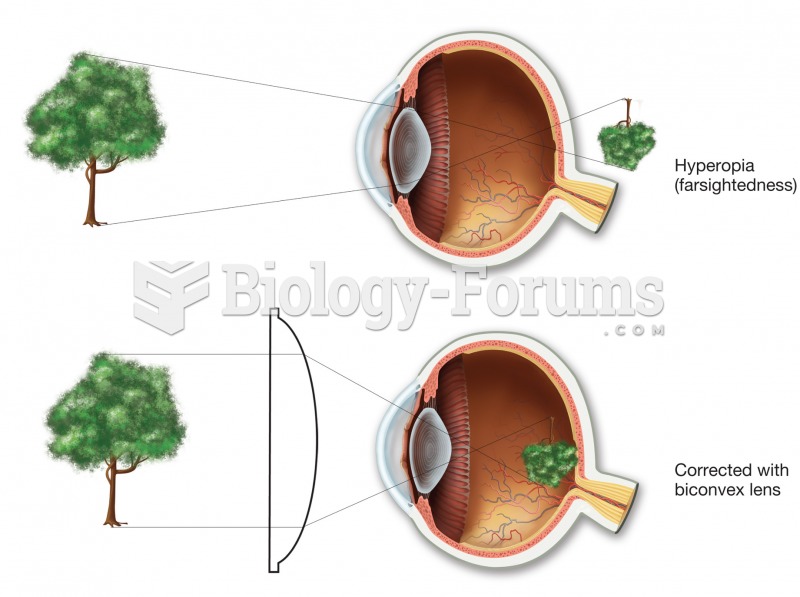 Hyperopia (farsightedness). In the uncorrected top figure, the image would come into focus behind th
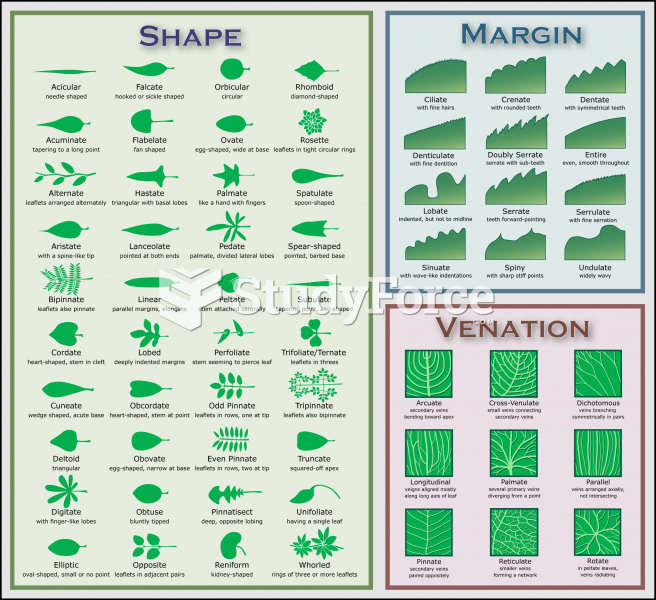 Plant Identification Chart
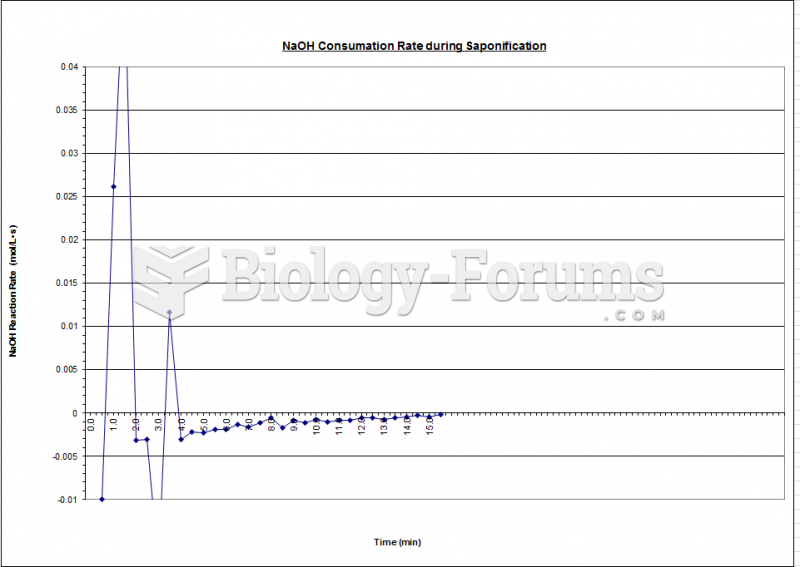 Fluidization - Reaction Rate Chart
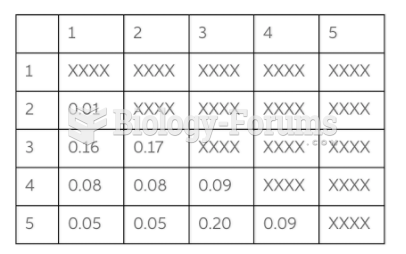 Chart
Chart
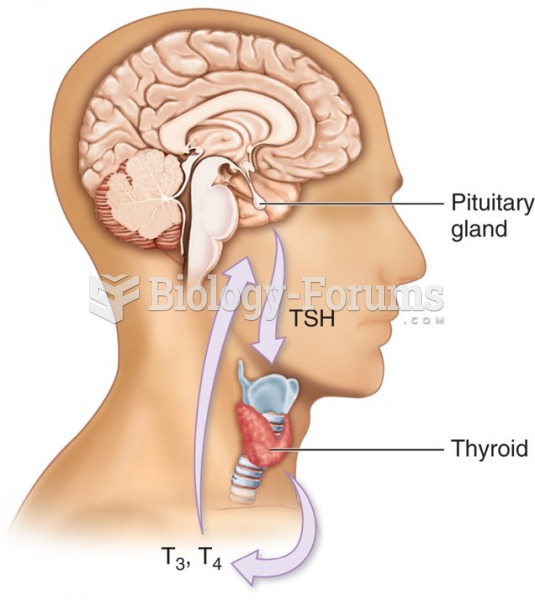 Thyroid hormone production—Relationship between pituitary and thyroid glands. Thyroid hormone ...
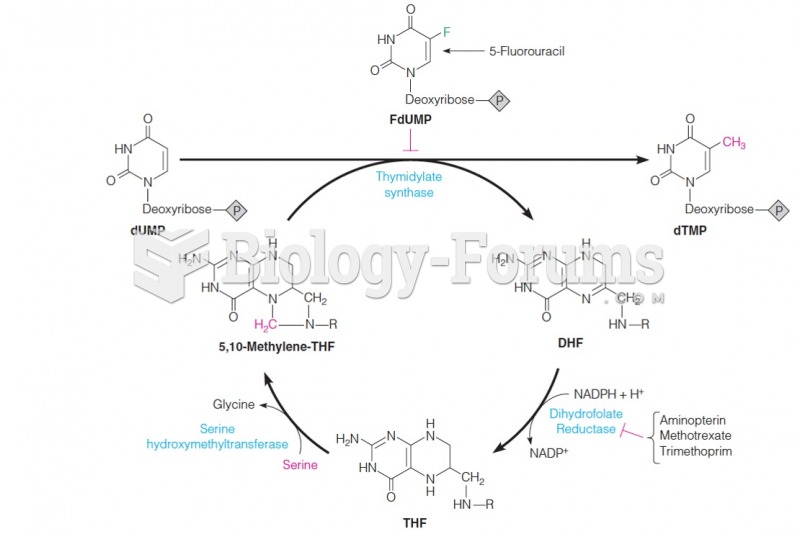 Relationship between thymidylate synthase and enzymes of tetrahydrofolate metabolism