This topic contains a solution. Click here to go to the answer
|
|
|

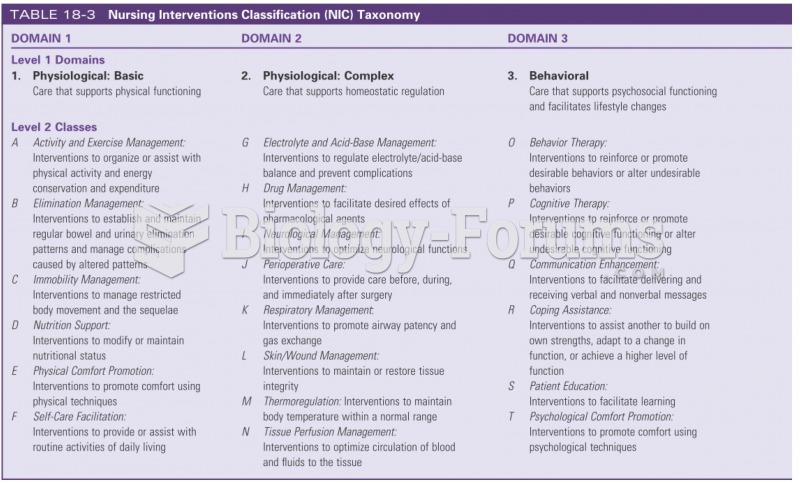 Nursing intervention classification
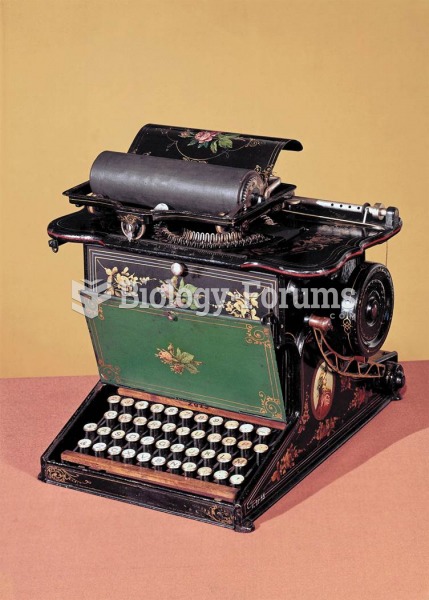 The first commercially successful typewriter, manufactured in quantity beginning in 1874, surely fue
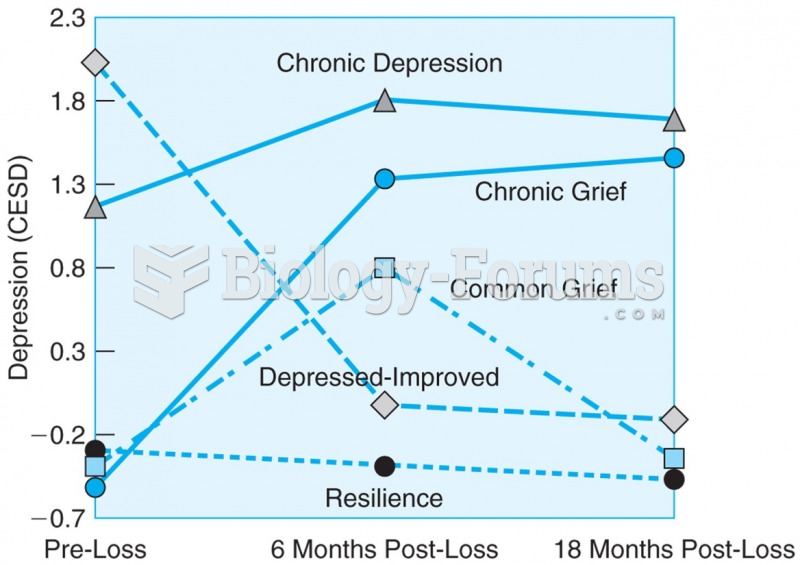 Bereaved spouses studied before loss, at the time of loss, and 18 months after loss show five ...
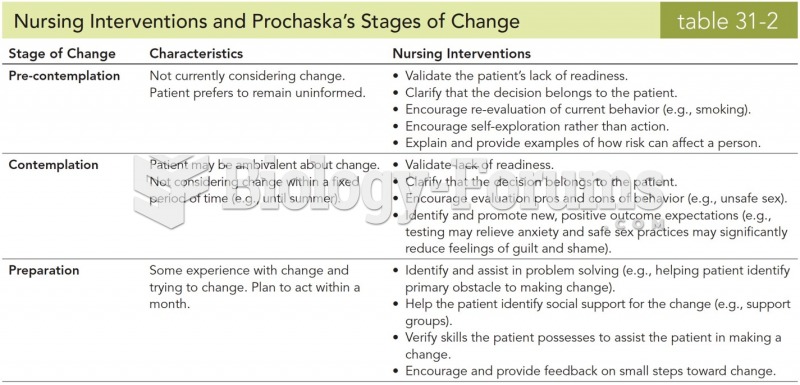 Nursing Interventions and Prochaska's Stages of Change
 Time course of HIV infection.
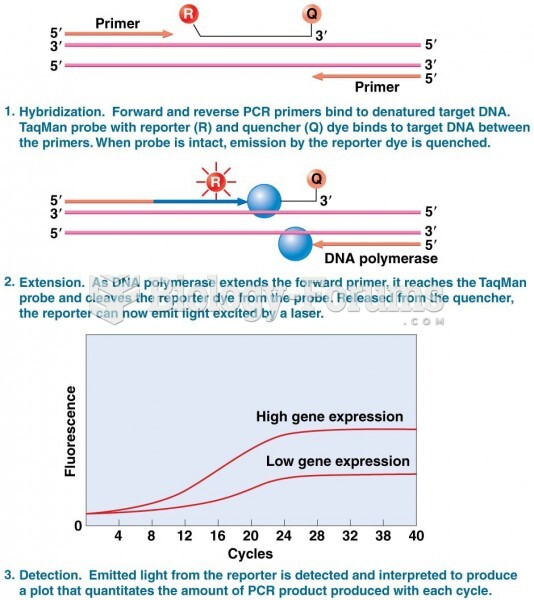 The TaqMan approach to quantitative real-time PCR (qPCR)