This topic contains a solution. Click here to go to the answer
|
|
|

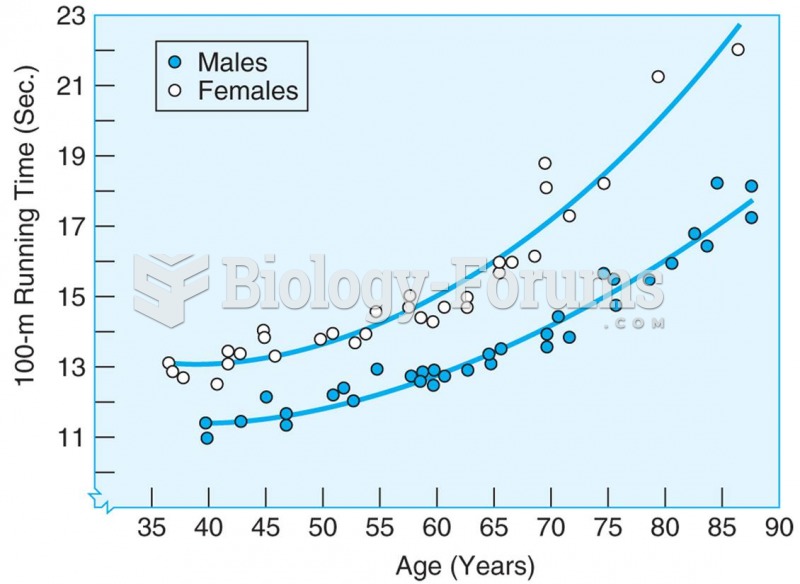 Running time on 100-meter sprint for men and women master athletes increases with age. Source: Korho
 How difficult is it for children to learn to speak two languages?
 Global climate change and CO2 concentration
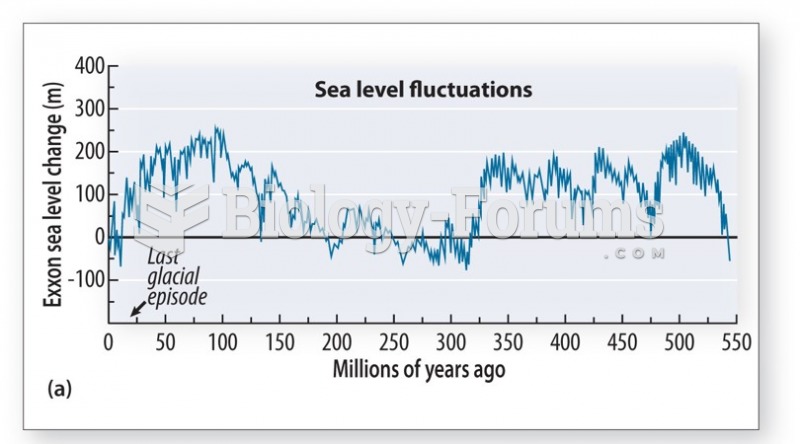 Normal change in sea level
 Weak bones cause the spine to collapse over time
 You're just on Time