This topic contains a solution. Click here to go to the answer
|
|
|

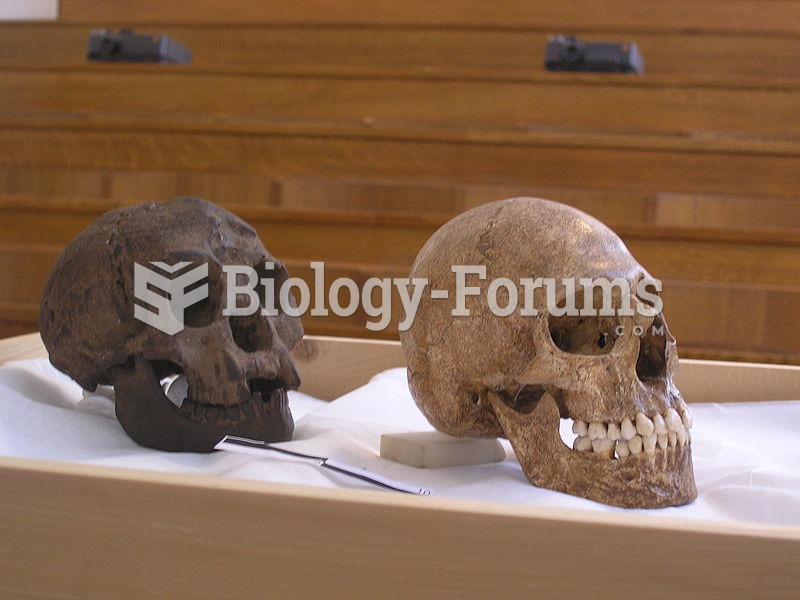 A cast of LB1 (left) was compared to several microcephalic skulls, amongst which is that of the micr
 Uranus's aurorae against its equatorial rings, imaged by the Hubble telescope. Unlike the auror
 Left auricle
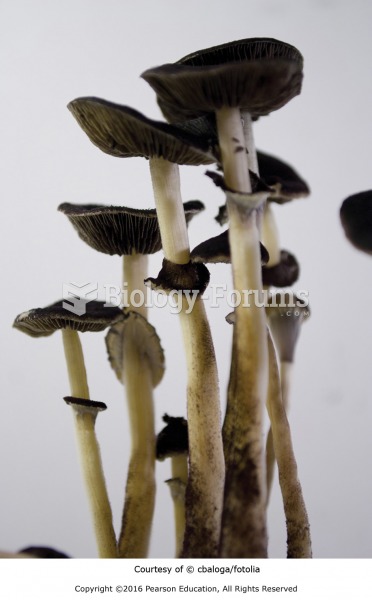 Psychoactive substances: (left) Psilocybin is obtained from a species of mushroom; (right) LSD is ...
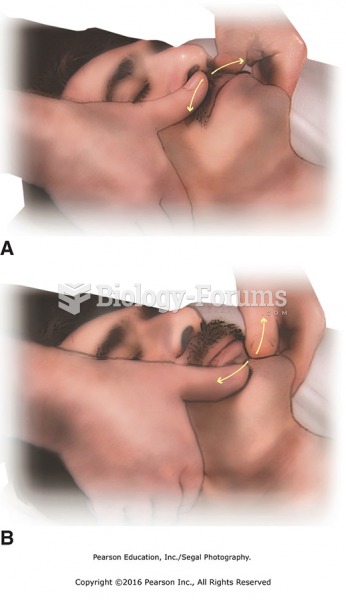 (A) Thumb slides above upper lip; to begin, fingers are placed near the ears, and thumbs begin at ...
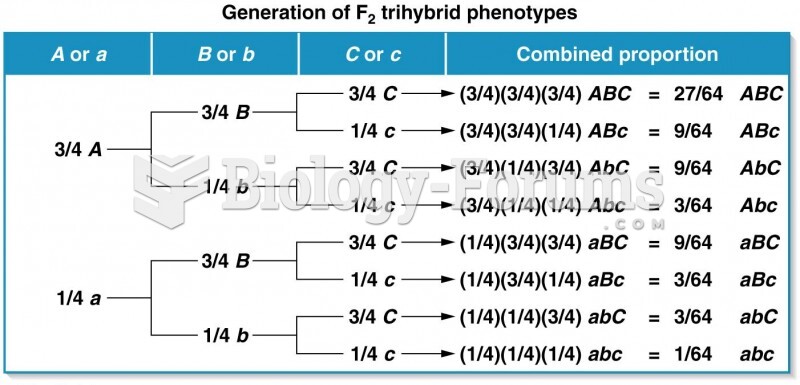 Generation of the F2 trihybrid phenotypic ratio using the forked-line method