This topic contains a solution. Click here to go to the answer
|
|
|

 Pocket gophers and ecosystem structure (data from Huntly and Inouye 1988).
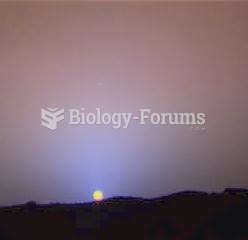 Sunlight on Mars is dimmer than on Earth. This photo of a Martian sunset was imaged by Mars Pathfind
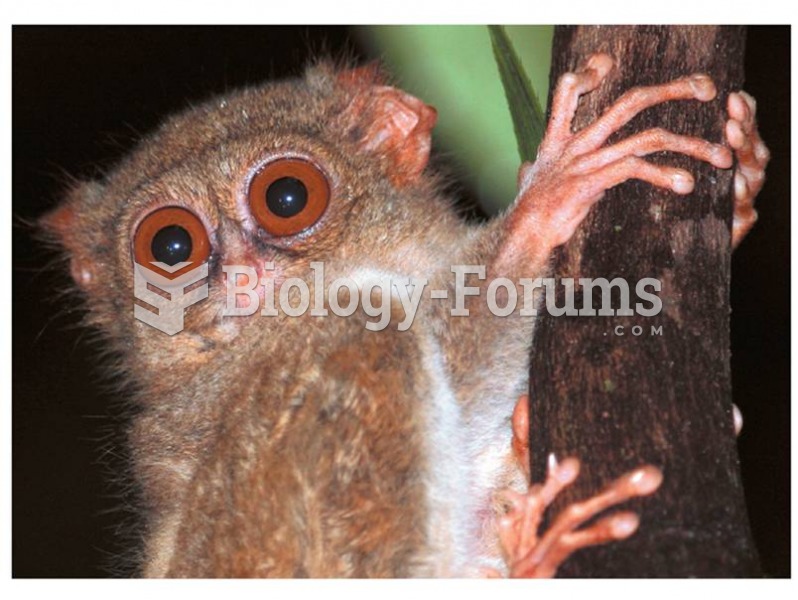 The tarsier is a haplorhine, and may represent an evolutionary bridge between lower and higher prima
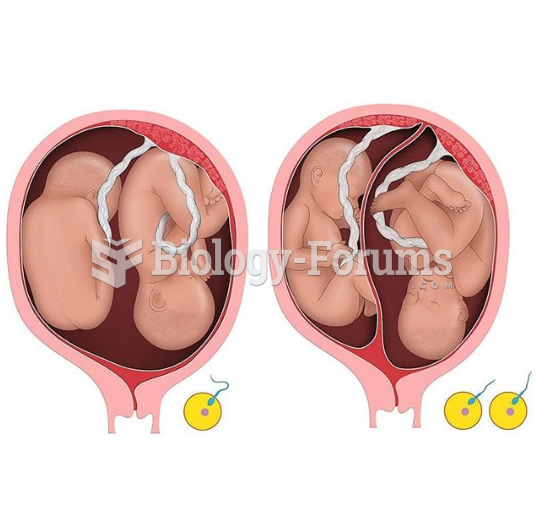 identical (left) and fraternal (right) twins
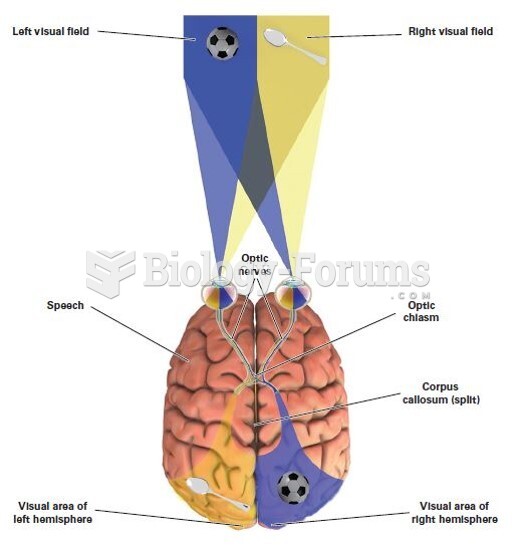 Right and Left Visual Fields
 Chi-Square Analysis of Mendel’s Trihybrid-Cross Data