This topic contains a solution. Click here to go to the answer
|
|
|

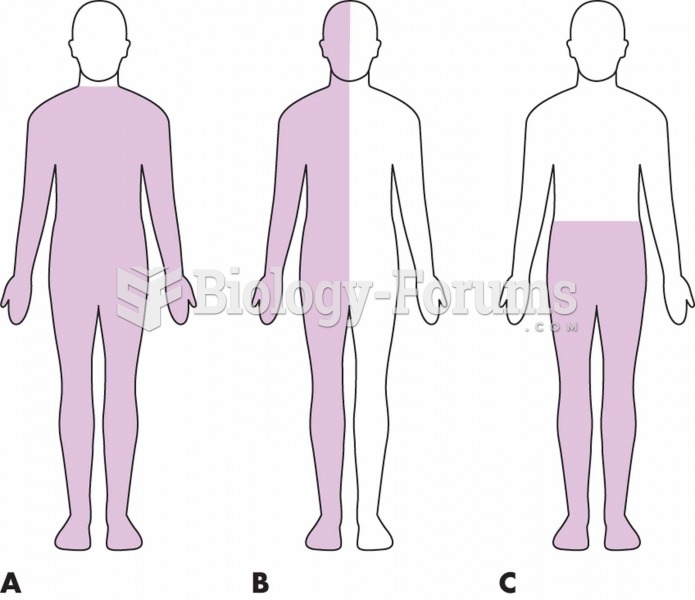 Types of paralysis: (A) Quadriplegia is complete or partial paralysis of the upper extremities and c
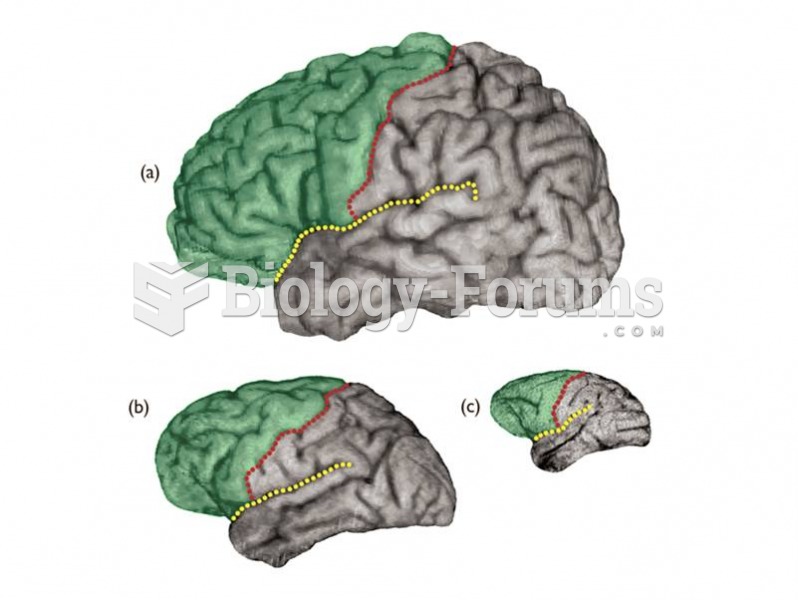 The frontal lobe (green) bounded by the Sylvian fissure (yellow line) and central sulcus (red line),
 Psychoactive substances: (left) Psilocybin is obtained from a species of mushroom; (right) LSD is ...
 Olowe Of Ise Veranda Posts (LEFT To RIGHT): Royal Wife With Twin Daughters
 Find a quadractic equation that models the data in standard form
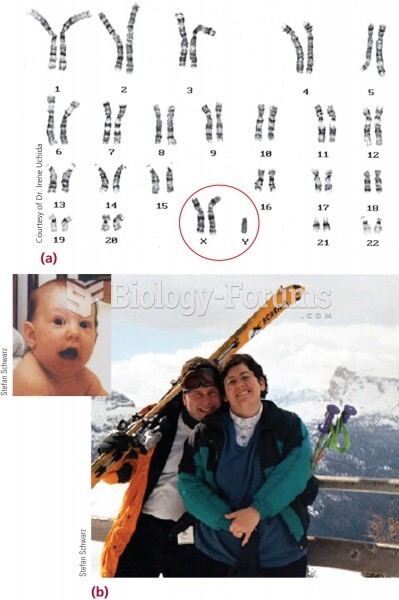 (a) The characteristic karyotype of Klinefelter syndrome. (b) The young man (left) in these photos h