This topic contains a solution. Click here to go to the answer
|
|
|

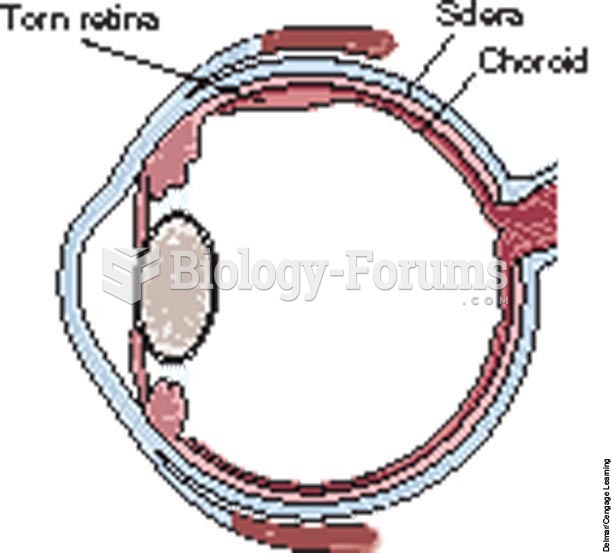 Scale used to measure pupil size in millimeters.
 Biology Forums Topic Display (2012 - Late 2014)
 All messages must be documented and placed in the patient's chart.
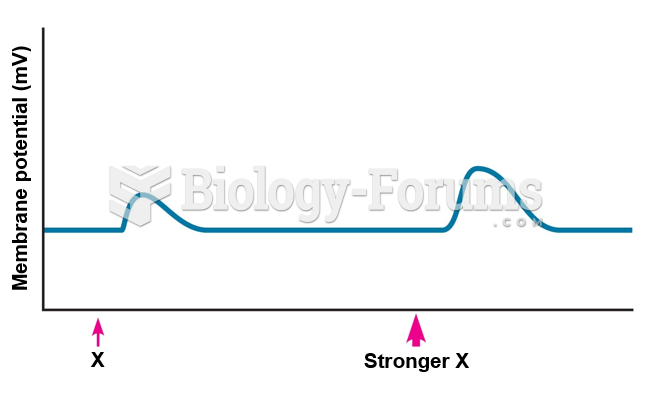 Effect of stimulus strength on size of graded potential.
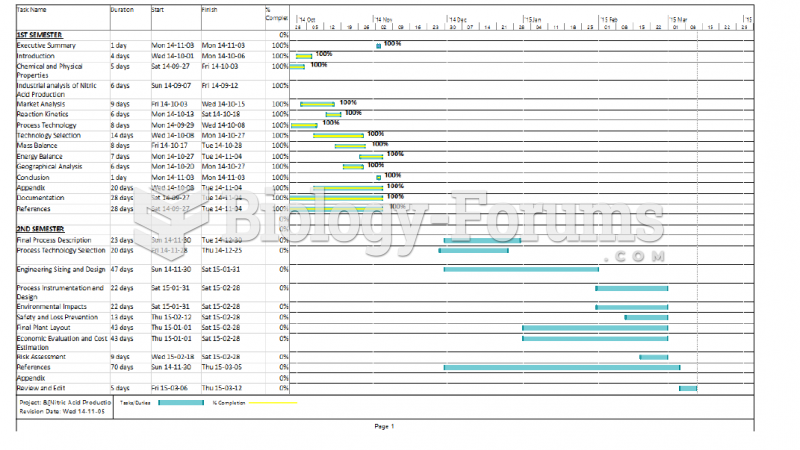 Gantt Chart
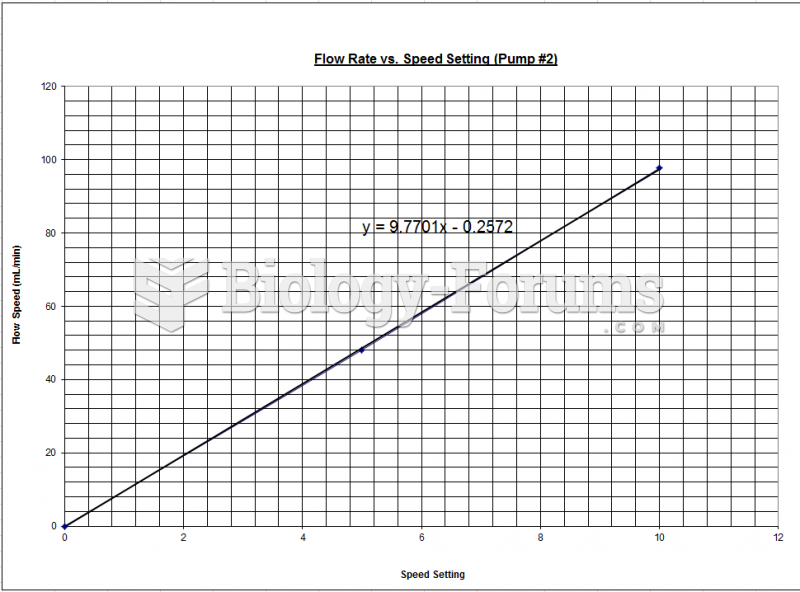 Fluidization - Chart Pump #2