This topic contains a solution. Click here to go to the answer
|
|
|

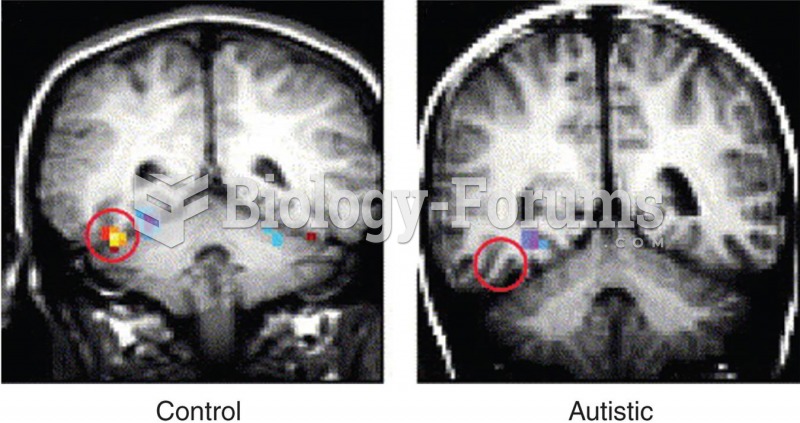 Fusiform Face Area and Autism
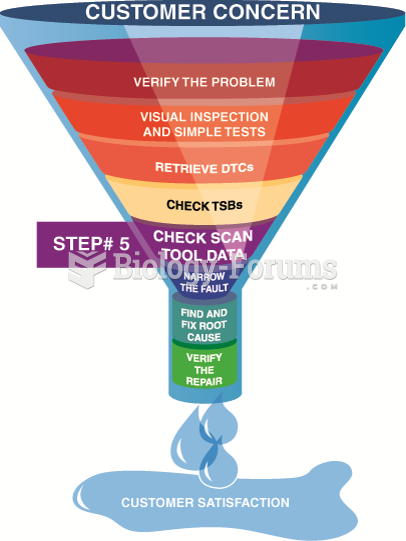 Looking carefully at the scan tool data is very helpful in locating the source of a problem.
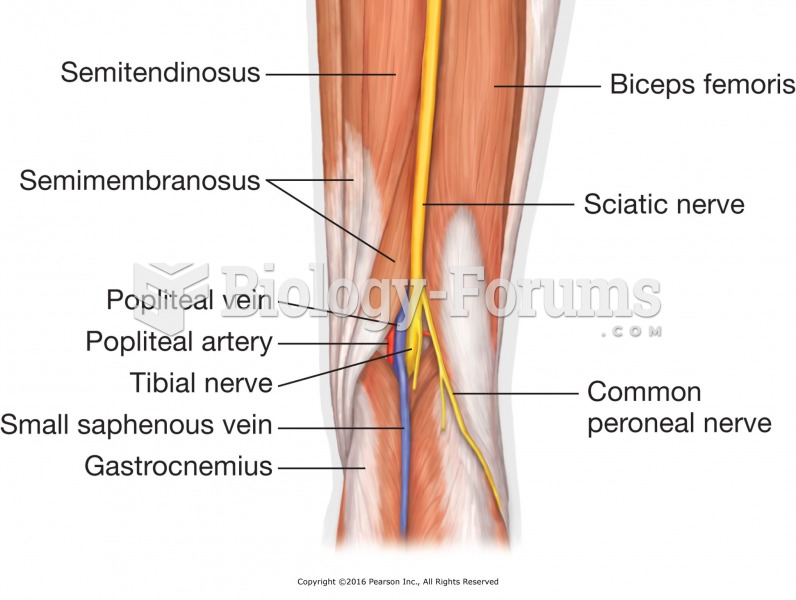 The popliteal area. Avoid heavy pressure over the back of the knee joint.
 Apply gentle circular friction to the temple area.
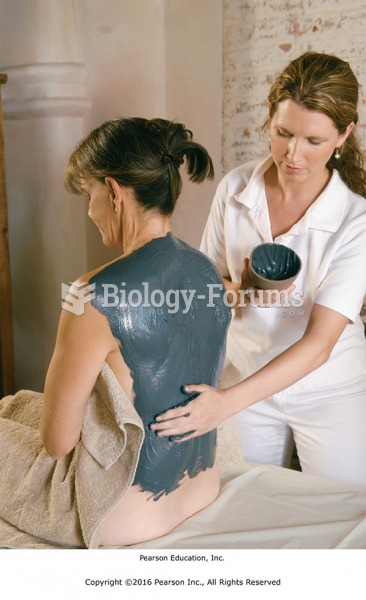 Apply the body wrap substance to the back with long, smooth strokes, covering the area thoroughly.
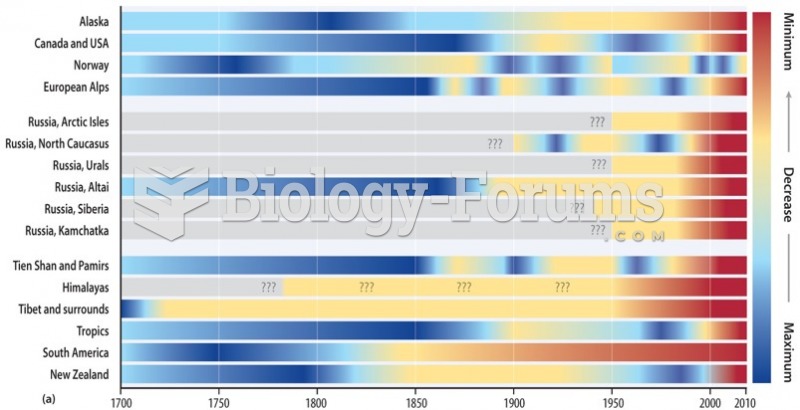 The European Alps have lost ~30% to 40% of surface area and ~50% of volume since the 1850s.