This topic contains a solution. Click here to go to the answer
|
|
|

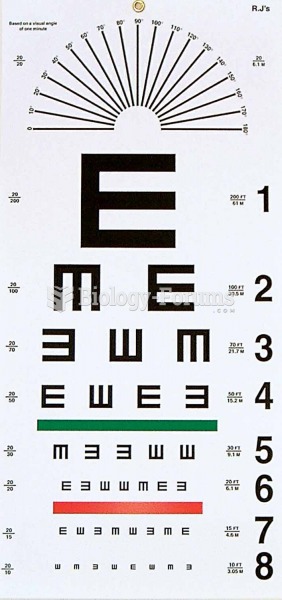 Snellen chart.
 Shy children often have a high arousal level in novel social situations. Over time, parents can help ...
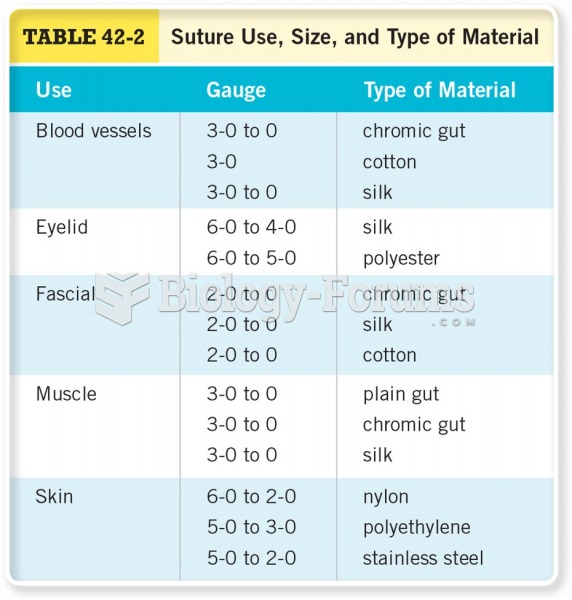 Suture Use, Size, and Type of Material
 An ECT sensor being tested using a digital meter set to DC volts. A chart showing the voltage ...
 Standing at the head of the table, apply oil or lotion to chest area. Spread lubricant fanning out ...
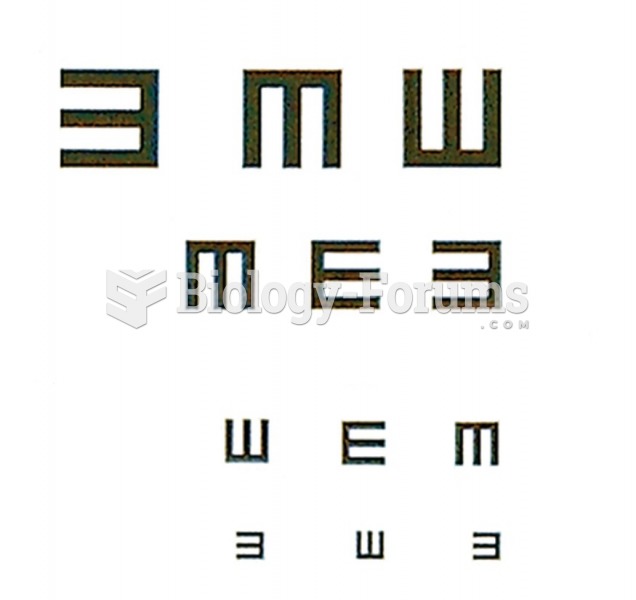 E chart for testing distant vision