This topic contains a solution. Click here to go to the answer
|
|
|

 Time-course of reprogramming mouse fibroblasts into induced pluripotent stem cells
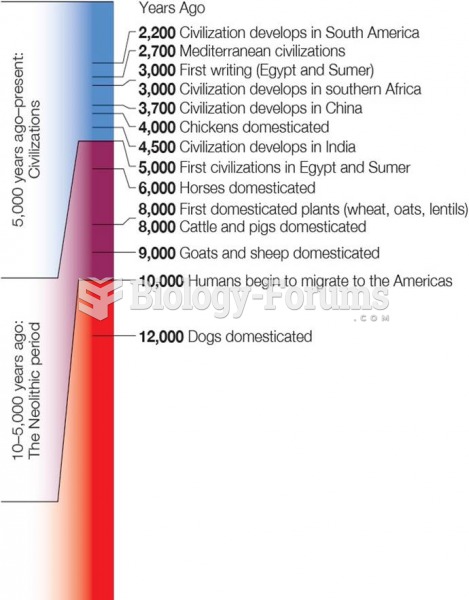 Time Line of Human History From Upper Paleolithic Period to the Present
 Richmond, Virginia, lies in ruins in April 1865 at the time of Lincoln’s visit—and a few days before
 The posted octane rating in most high-altitude areas shows regular at 85 instead of the usual 87.
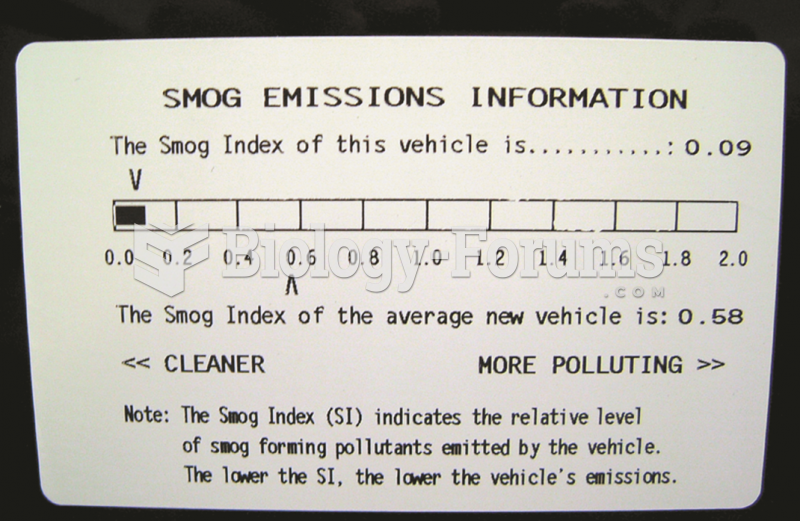 This label on a Toyota Camry hybrid shows the relative smog-producing emissions, but this does not ...
 Insomnia severity vs. time