This topic contains a solution. Click here to go to the answer
|
|
|

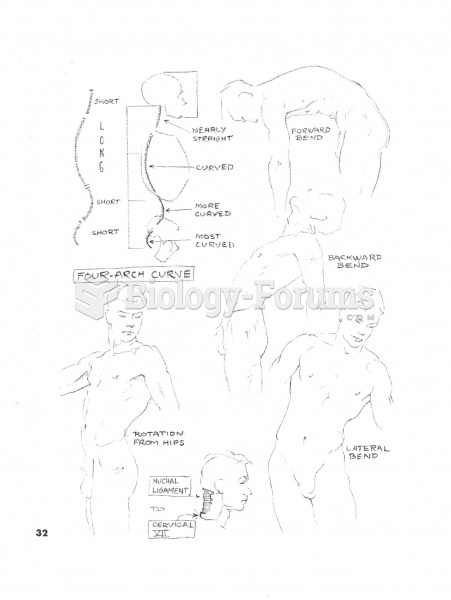 Four Arch Curve
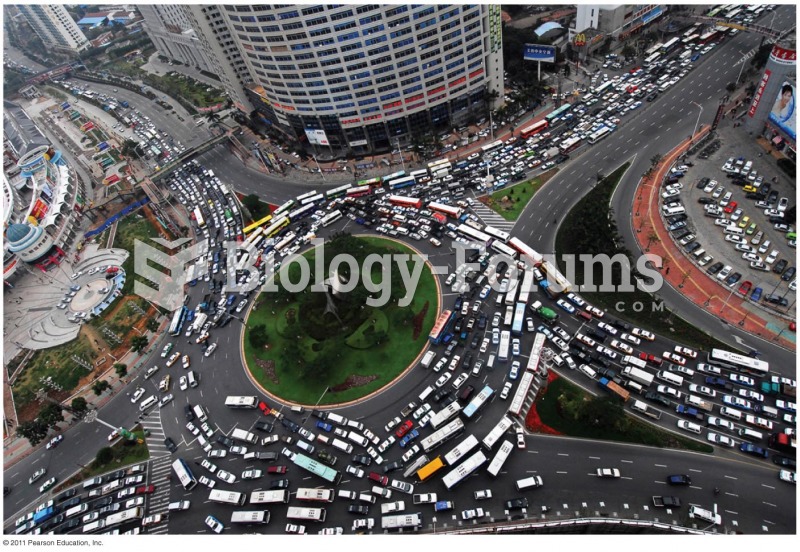 An Oil-dependent World— Supply and Demand Driven
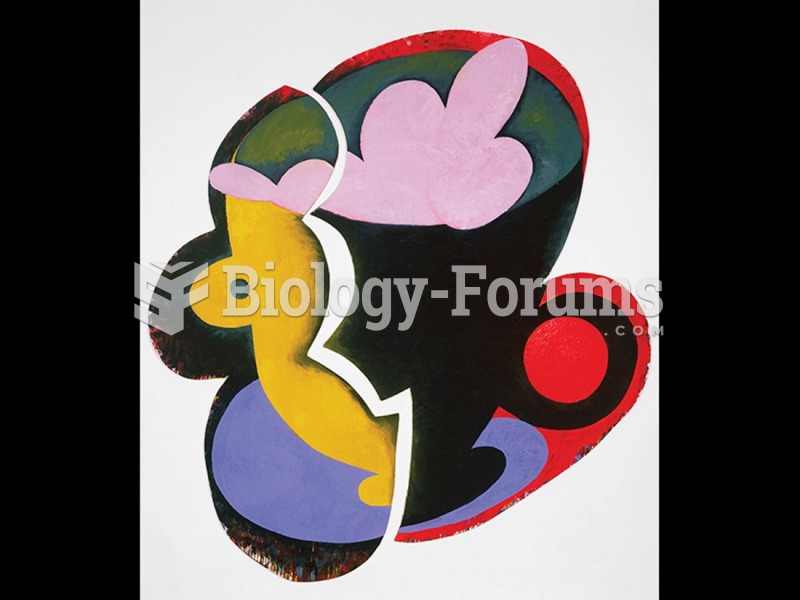 Elizabeth Murray, Just in Time.
 This image shows the spread of droplets from an uncovered sneeze.
 Mobilize knuckles with figure-8s. Turn the hand so palm faces the table. Grasp the proximal phalange ...
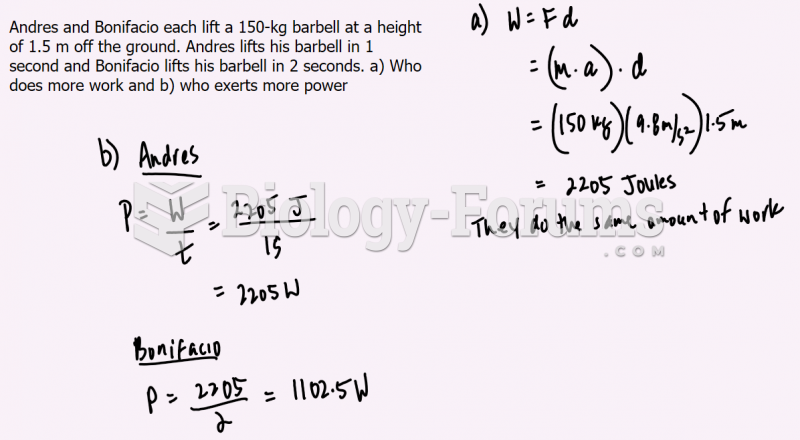 Physics: Power, Energy and Time