This topic contains a solution. Click here to go to the answer
|
|
|

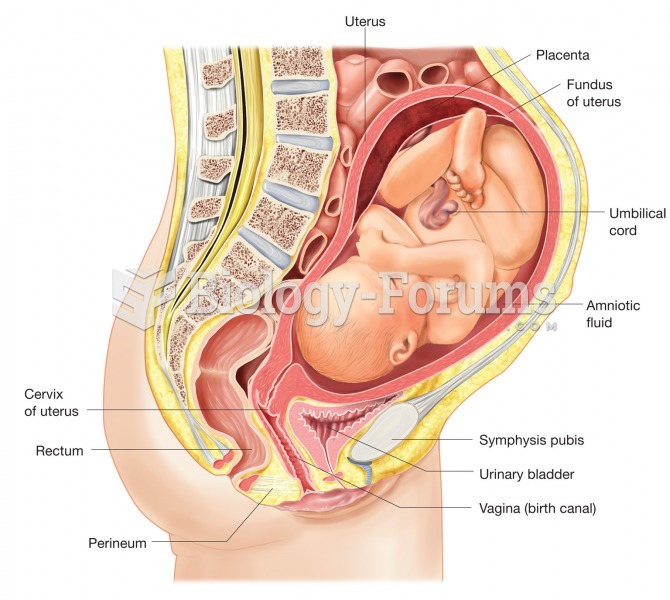 A full-term pregnancy. Image illustrates position of the fetus and the structures associated with pr
 Jaguar F-type front
 A severe case of delayed contact dermatitis (Type IV hypersensitivity) from wearing latex gloves.
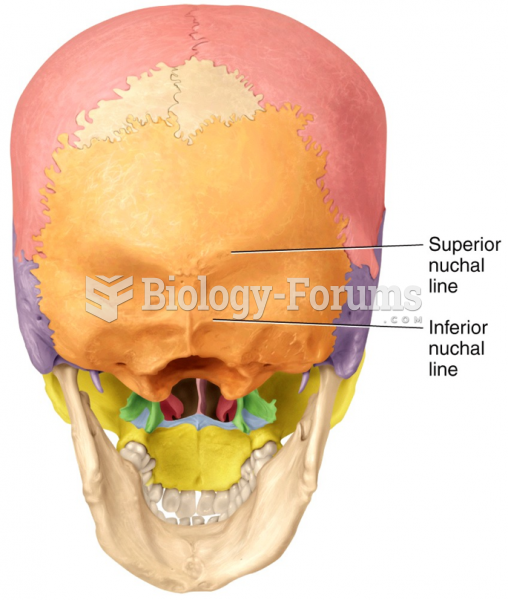 Nuchal Line
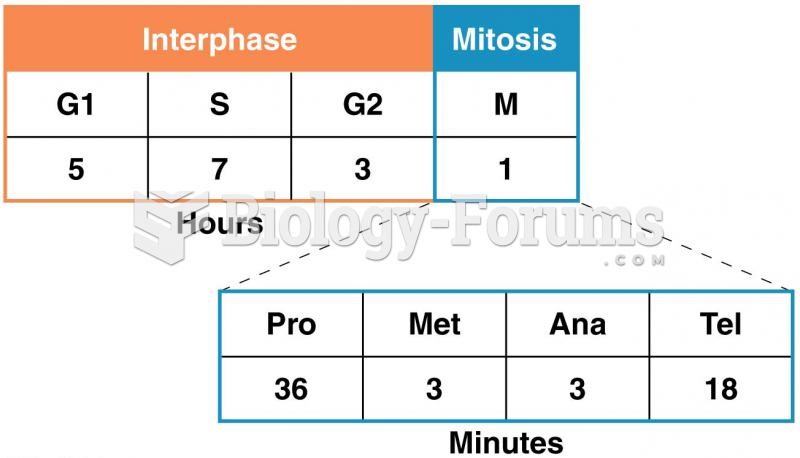 The time spent in each interval of one complete cell cycle of a human cell in culture
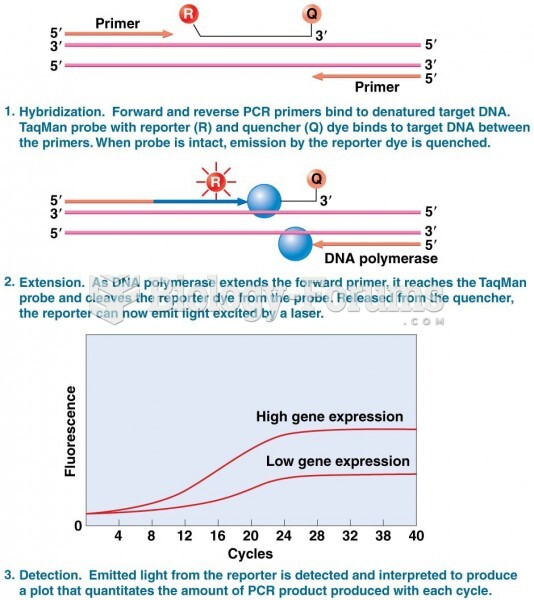 The TaqMan approach to quantitative real-time PCR (qPCR)